Forest plot module
forest.Rmd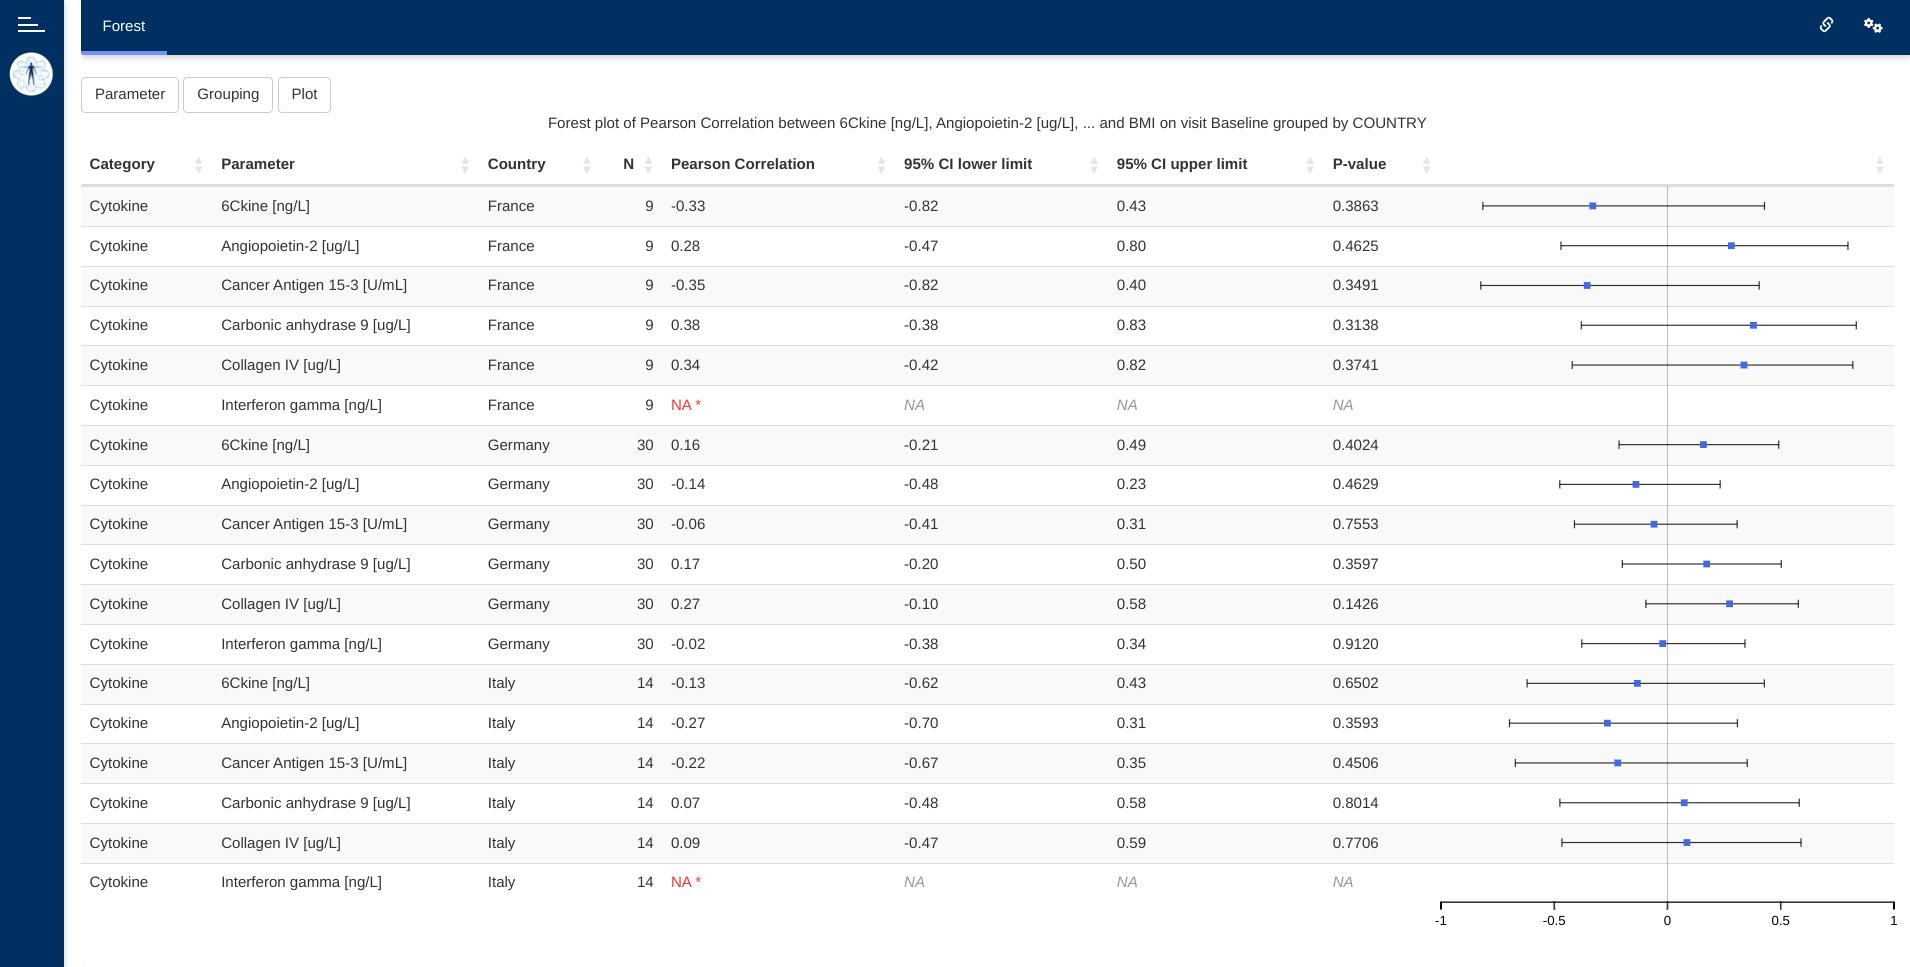
This guide provides guidance on creating Apps in DaVinci using the
forest module. Walk-throughs for sample app creation are
also included to demonstrate various module-specific features.
The forest module displays a hybrid table/forest plot of
arbitrary statistics (correlations, odds ratios, …) computed on dataset
parameters over a single visit.
Pre-requisite:
 “Parameter”
Term Disambiguation
“Parameter”
Term Disambiguation
The guide uses the term “parameter” at several places. This term in the guide represents clinical analysis parameters and values such as laboratory values, safety values, etc as used in the clinical dataset context. This can be confused with the word parameter as used in a programming context - “parameters of a function”. Therefore, to fully disambiguate the usage in this guide:
- Parameter is used exclusively in the clinical dataset context
- Argument is used to represent parameter of a function in the programming context
Features
The forest module offers the following features:
- Table with results of applying arbitrary app-creator-supplied functions over pairs of parameters of a dataset.
- Hover-on explanation of
NAresults on cells of that table. - Row-aligned plot depicting table results.
This module supports bookmarking.
Module arguments
The dv.explorer.parameter::mod_forest() module presents
mandatory and optional function arguments to the app creator.
Mandatory Arguments
module_id: A unique identifier of type character for the module in the app.-
bm_dataset_name: The dataset that contains the continuous parameters. It expects a dataset similar to https://www.cdisc.org/kb/examples/adam-basic-data-structure-bds-using-paramcd-80288192 , 1 record per subject per parameter per analysis visit.It should have, at least, the columns passed in the optional arguments,
subjid_var,cat_var,par_var,visit_varandvalue_vars. -
group_dataset_name:It expects a dataset with a structure similar to https://www.cdisc.org/kb/examples/adam-subject-level-analysis-adsl-dataset-80283806 , one record per subject It should have, at least, the column passed in the optional argument
subjid_var. -
numeric_numeric_functionsandnumeric_factor_functions:The application creator can supply two lists of arbitrary functions through these arguments.
These functions will be applied to user-selected pair-wise combinations of parameters of
bm_datasetand should return four numeric values. Two of those values will be used to define the range of the “trees” of the forest plot, another one will mark the central value of each of them and the remaining value will only be shown as part of the table accompanying the plot.Example: Function that returns a correlation coefficient between to numerical parameters, along with upper and lower confidence intervals and a p-value.
As the names of the arguments imply,
numeric_numeric_functionsapply to combination of numerical paramaters on the dataset, whilenumeric_factor_functionsneeds for one of them to be categorical and encoded asfactor.
Refer to dv.explorer.parameter::mod_forest() for the
complete list of arguments and their description.
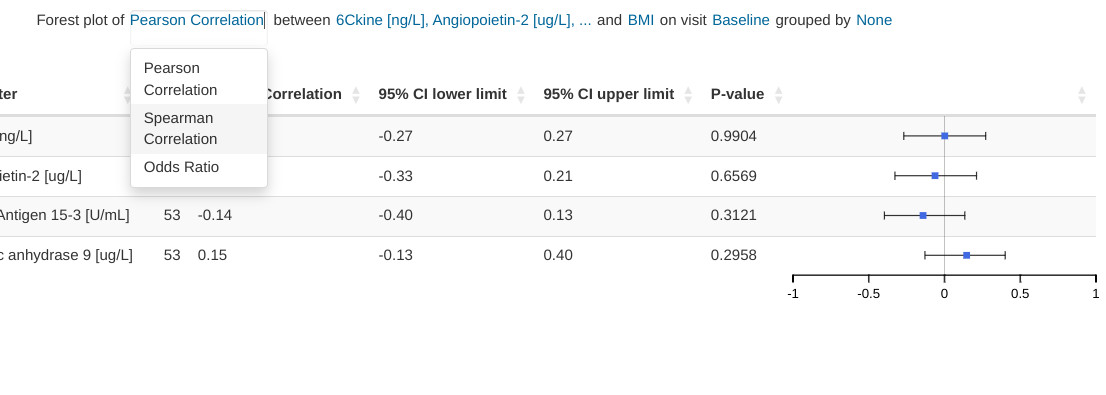
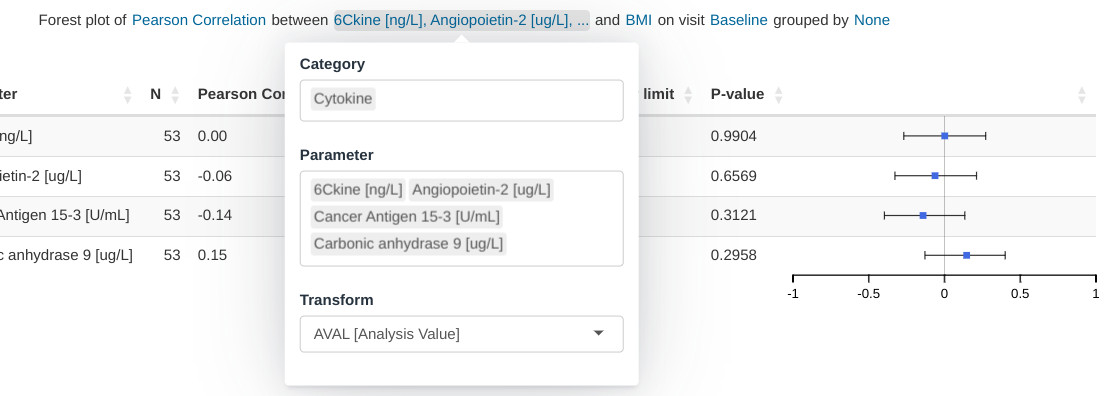
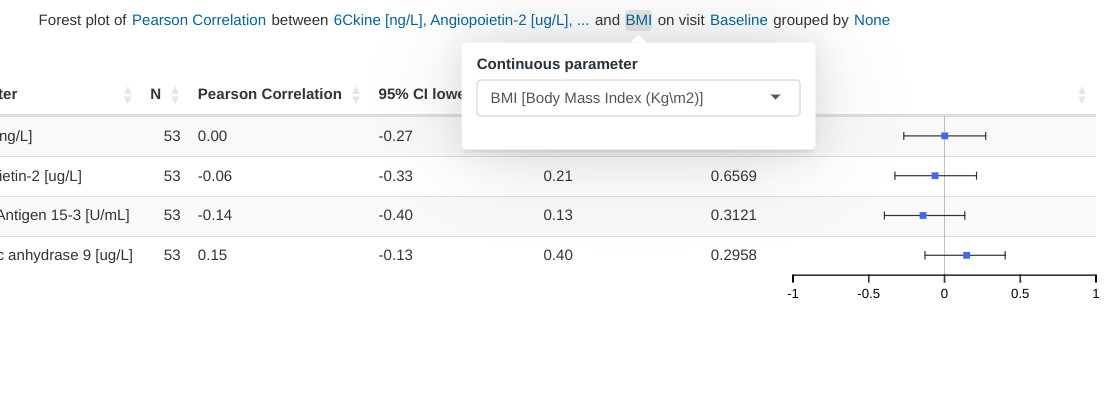
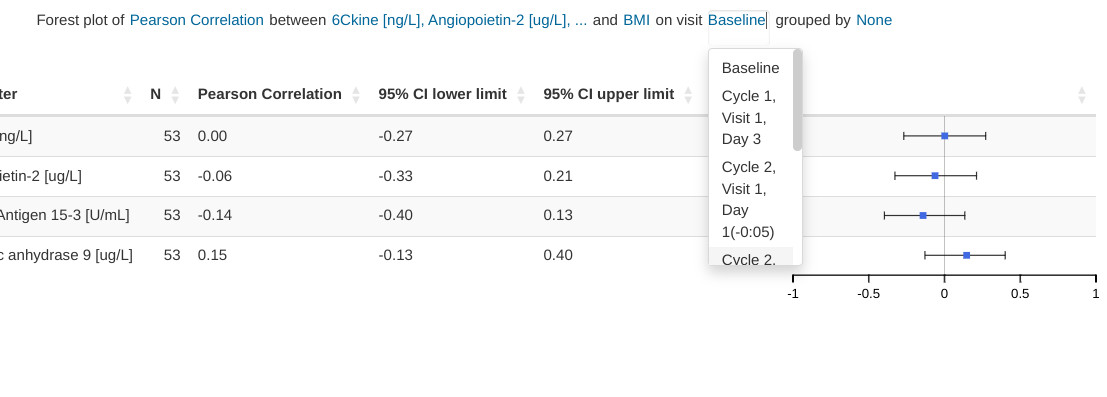
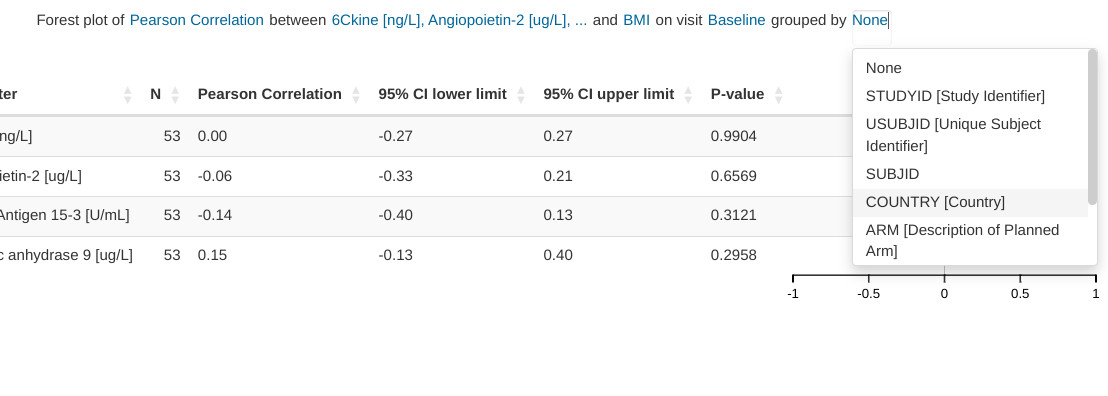
Input menus
Input menus are integrated as part of the figure title. Portions of the title are stylized as hyperlinks and reveal the relevant pop-up menus when clicked.
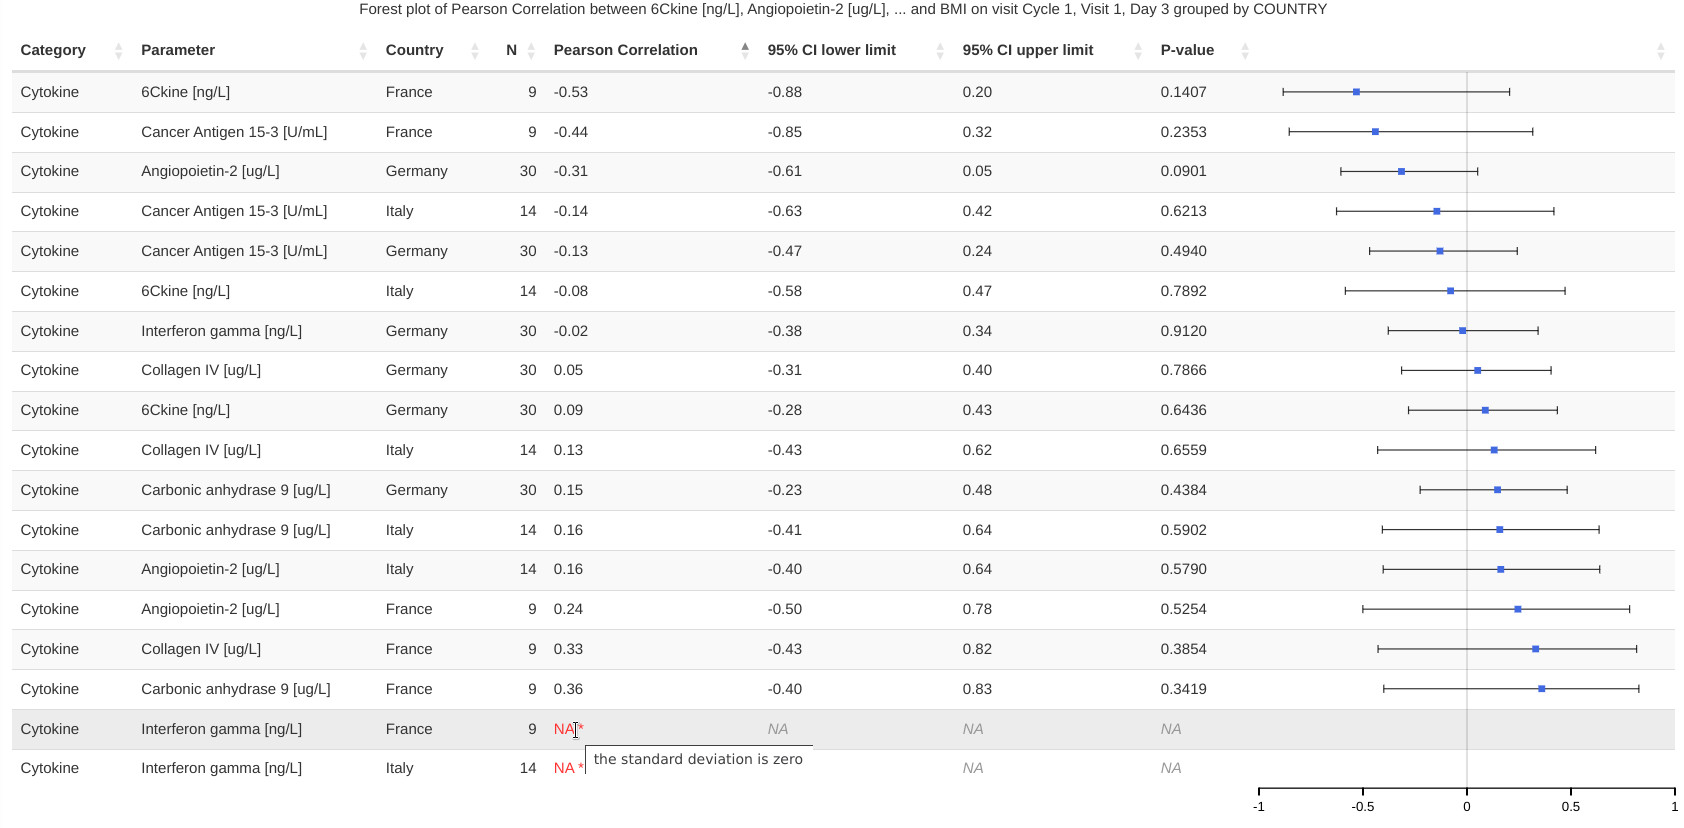
Hybrid table/plot
This visualizations consists of a table and a row-aligned forest plot. The plot makes it easier for the user to navigate the data. Controls embedded in the table headings allow arbitrary reorderings of the table (e.g. ascending Pearson correlation coefficient shown in the following image).
Creating a forest plot application
adbm_dataset <- dv.explorer.parameter:::safety_data()[["bm"]]
adsl_dataset <- dv.explorer.parameter:::safety_data()[["sl"]]

fp_numeric_numeric_functions <- list(
  "Pearson Correlation" = dv.explorer.parameter::pearson_correlation,
  "Spearman Correlation" = dv.explorer.parameter::spearman_correlation
)
fp_numeric_factor_functions <- list(
  "Odds Ratio" = dv.explorer.parameter::odds_ratio
)

dv.manager::run_app(
  data = list("DS" = list(adbm = adbm_dataset, adsl = adsl_dataset)),
  module_list = list(
    "Forest Plot" = dv.explorer.parameter::mod_forest(
      "forestplot",
      bm_dataset_name = "adbm",
      group_dataset_name = "adsl",
      subjid_var = "USUBJID",
      cat_var = "PARCAT1",
      par_var = "PARAM",
      visit_var = "AVISIT",
      value_vars = "AVAL",
      numeric_numeric_functions = fp_numeric_numeric_functions,
      numeric_factor_functions = fp_numeric_factor_functions
    )
  ),
  filter_data = "adsl",
  filter_key = "USUBJID"
)