Boxplot module
boxplot.Rmd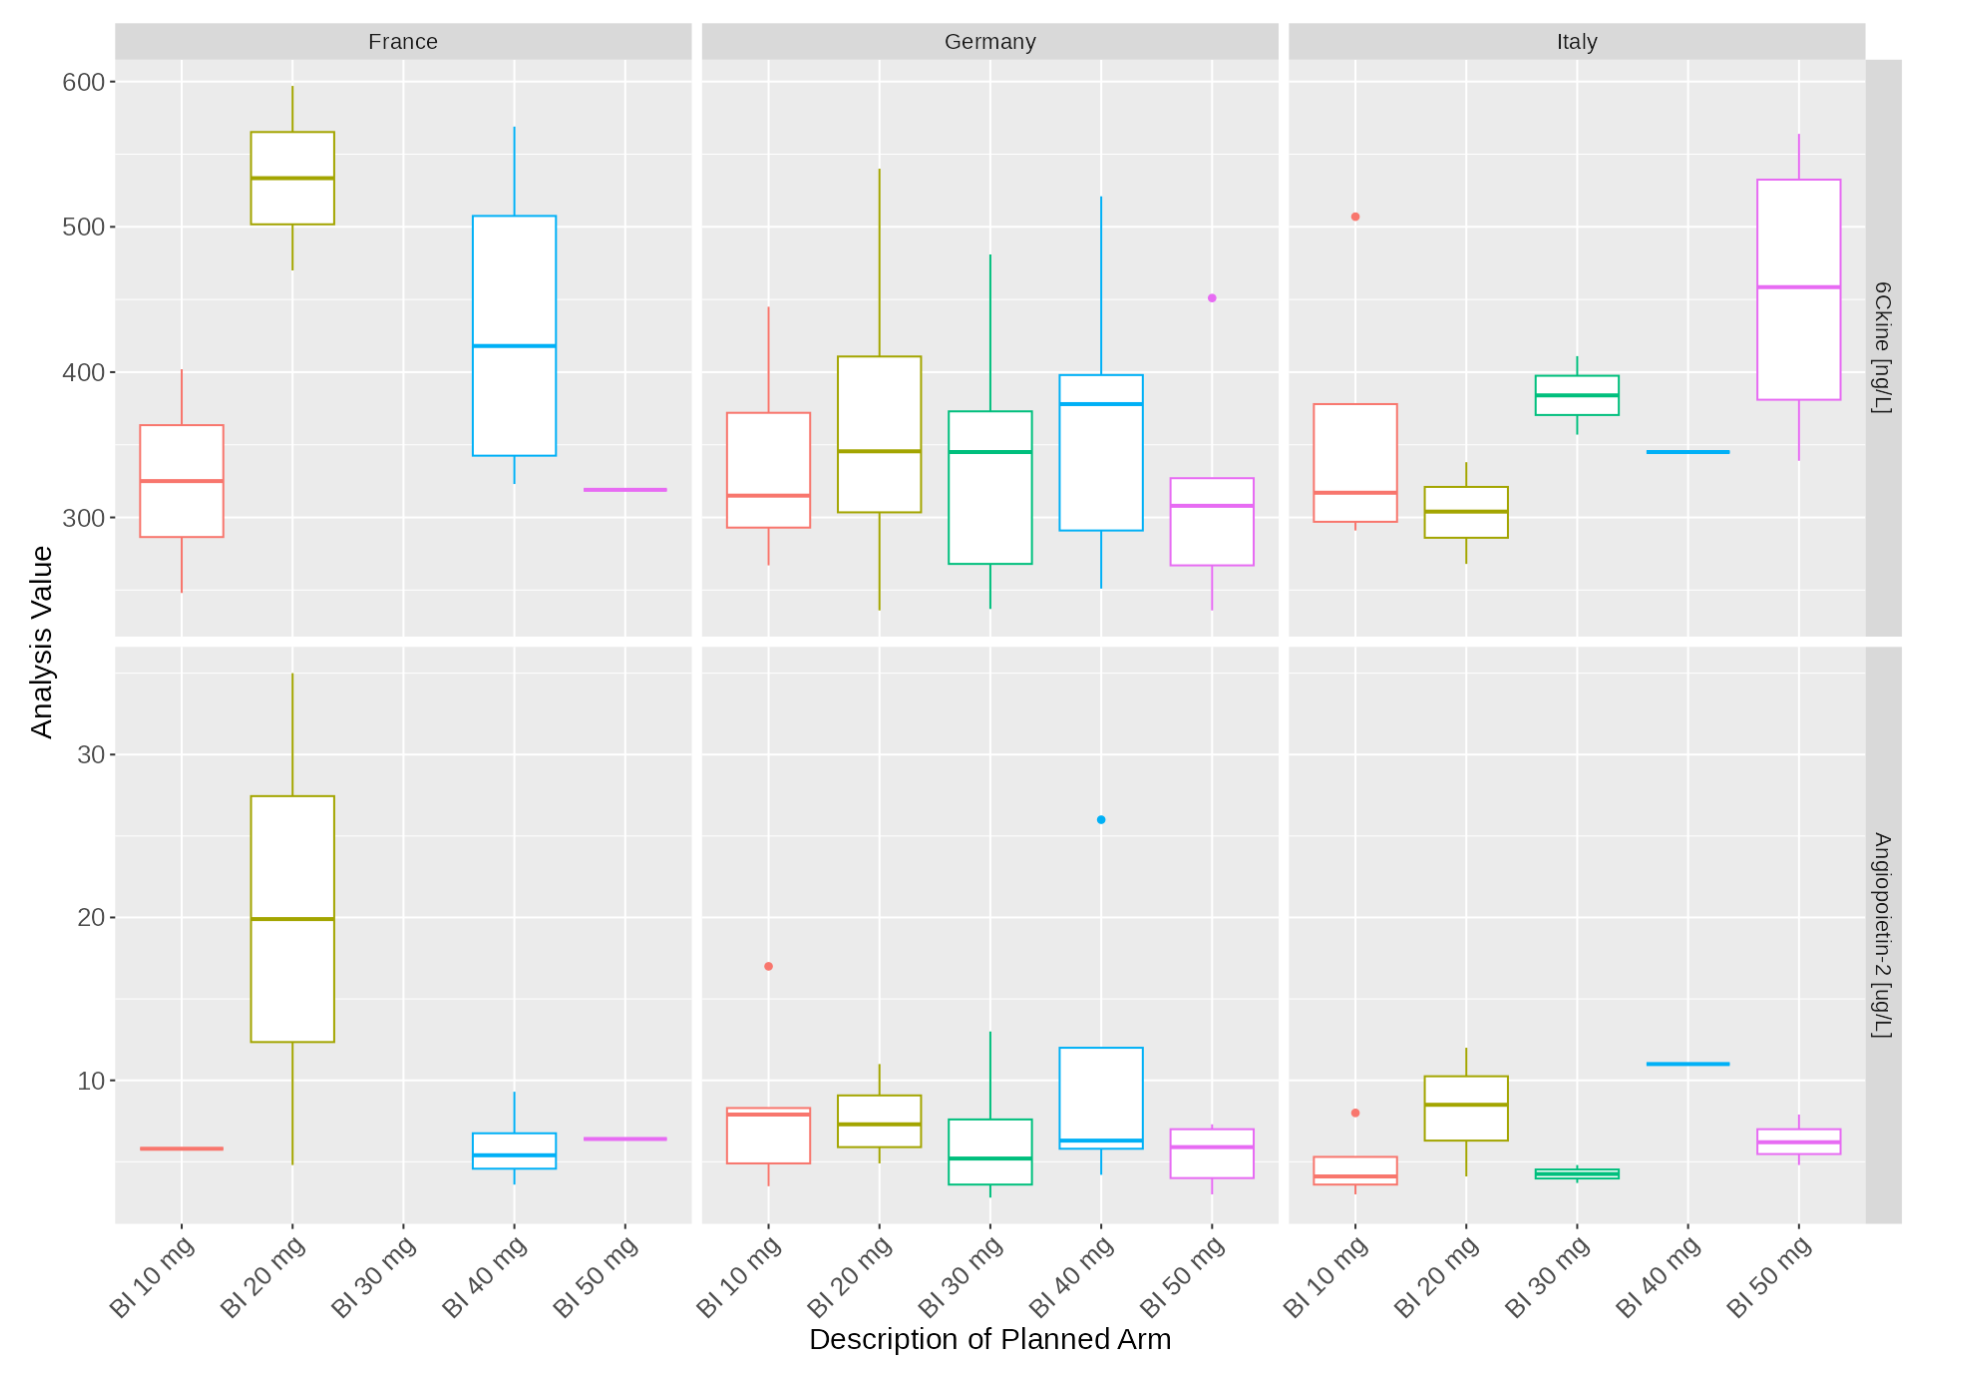
This guide provides a detailed overview of the boxplot
module and its features. It is meant to provide guidance to App Creators
on creating Apps in DaVinci using the boxplot module.
Walk-throughs for sample app creation using the module are also included
to demonstrate the various module specific features.
The boxplot module makes it possible to visualize a
boxplot chart of parameters, and several tables with population
listings, summary statistics and between group stat comparisons.
Pre-requisite:
 “Parameter”
Term Disambiguation
“Parameter”
Term Disambiguation
The guide uses the term “parameter” at several places. This term in the guide represents clinical analysis parameters and values such as laboratory values, safety values, etc as used in the clinical dataset context. This can be confused with the word parameter as used in a programming context - “parameters of a function”. Therefore, to fully disambiguate the usage in this guide:
- Parameter is used exclusively in the clinical dataset context
- Argument is used to represent parameter of a function in the programming context
Features
boxplot features the following plot and tables:
- A set of boxplot/violin charts with different custom groupings and optionally showing the individual data points.
- A table showing the population listing of the selected boxplot
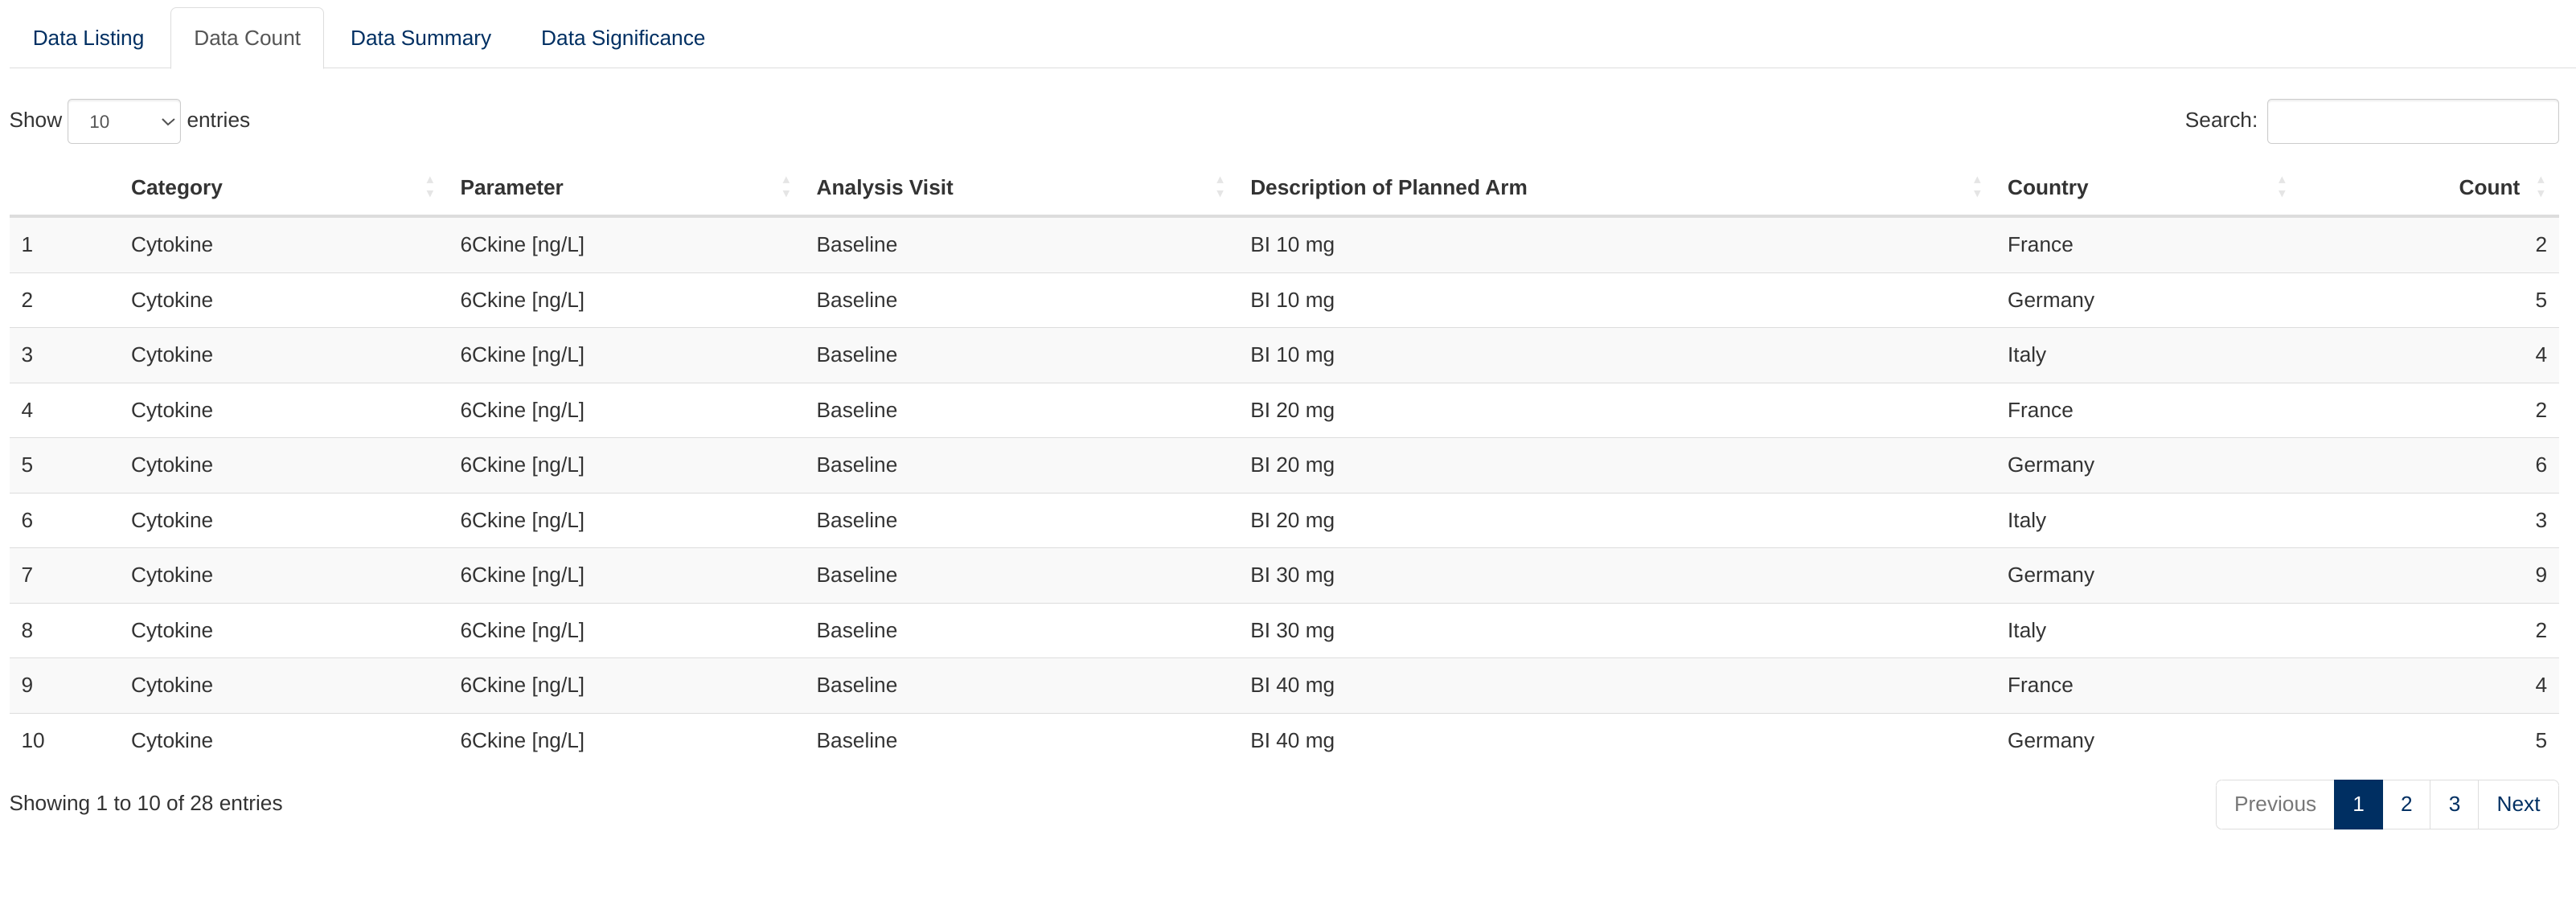
- A table showing the number of subjects per boxplot
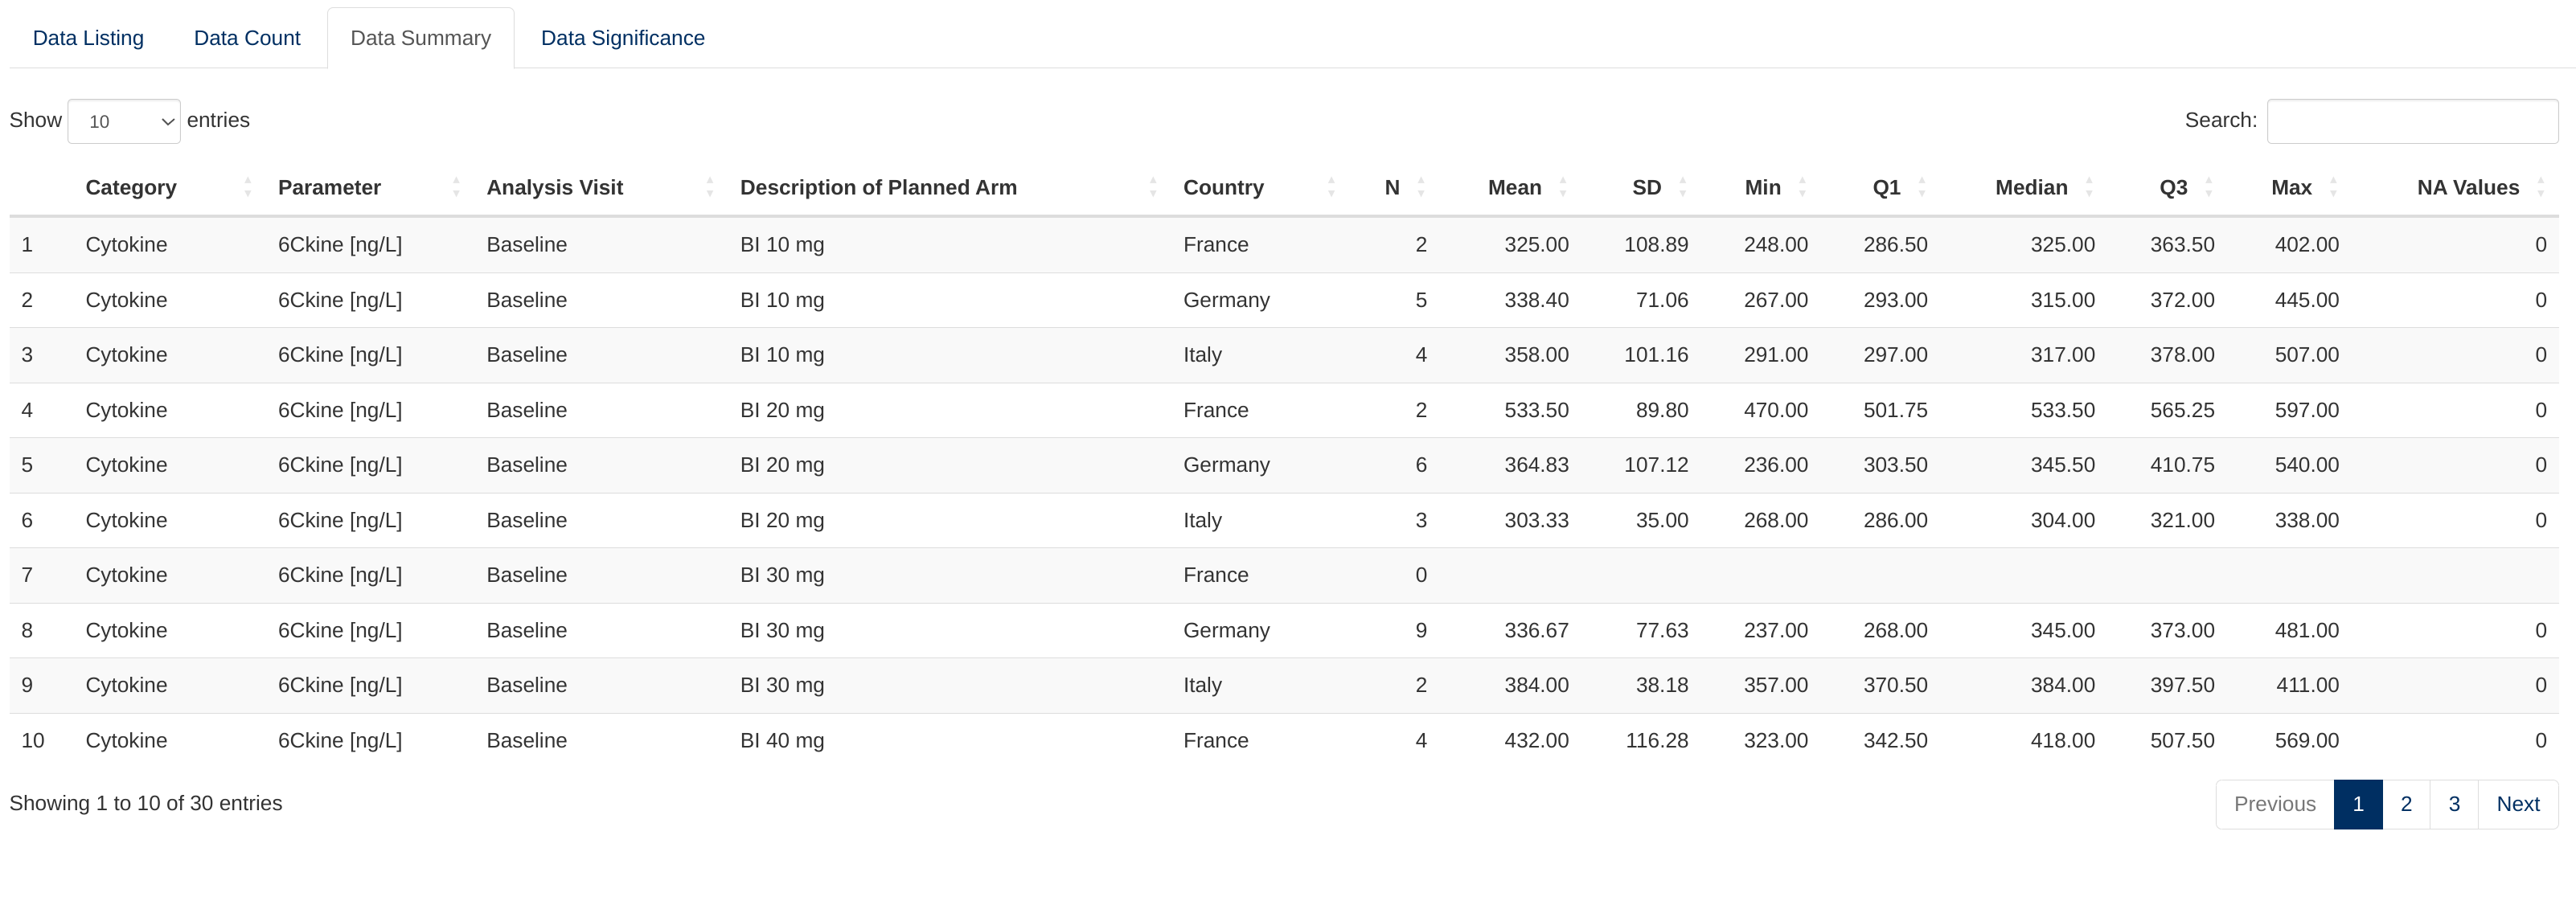
- A table showing the number of subjects per boxplot and addition stats on the parameter value distribution
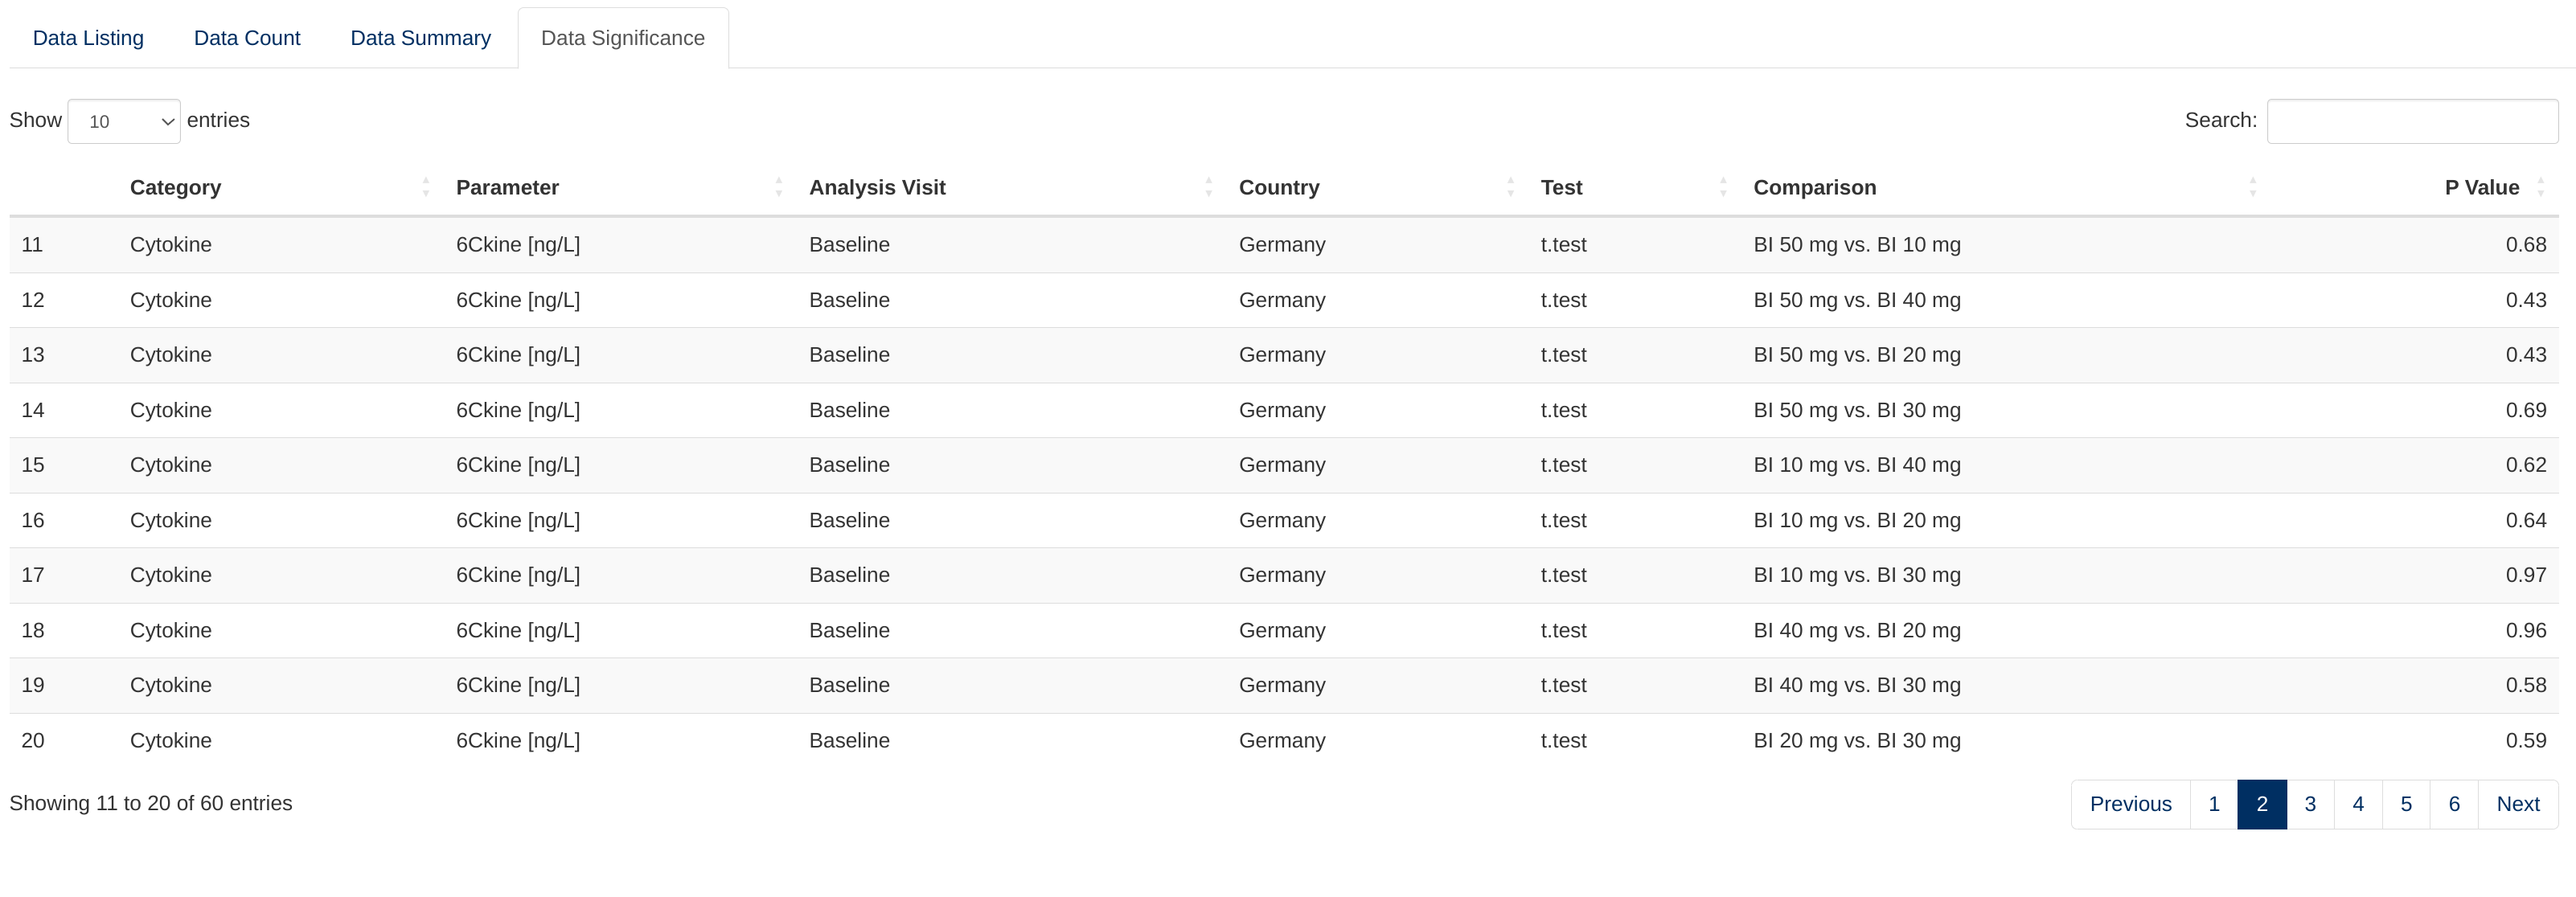
- A table containing a set of statistical tests comparing the mean parameter value between groups
It supports bookmarking.
Arguments for the module
dv.explorer.parameter::mod_boxplot() module uses several
arguments with the following being mandatory and the rest optional. As
part of app creation, the app creator should specify the values for
these arguments as applicable.
Mandatory Arguments
module_id: A unique identifier of type character for the module in the app.subjid_var: A common column across all datasets that uniquely identify subjects. By default: “SUBJID”-
bm_dataset_name: The dataset that contains the continuous parameters. It expects a dataset similar to https://www.cdisc.org/kb/examples/adam-basic-data-structure-bds-using-paramcd-80288192 , 1 record per subject per parameter per analysis visitIt expects, at least, the columns passed in the arguments,
subjid_var,cat_var,par_var,visit_varandvalue_vars. -
group_dataset_name:It expects a dataset with an structure similar to https://www.cdisc.org/kb/examples/adam-subject-level-analysis-adsl-dataset-80283806 , one record per subject It expects to contain, at least,
subjid_var
Refer to dv.explorer.parameter::mod_boxplot() for the
complete list of arguments and their description.
Input menus
 |
 |
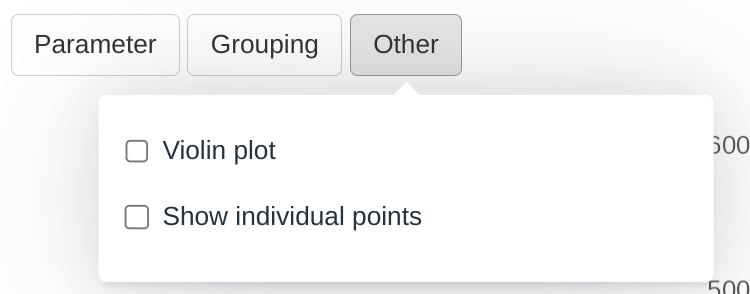 |
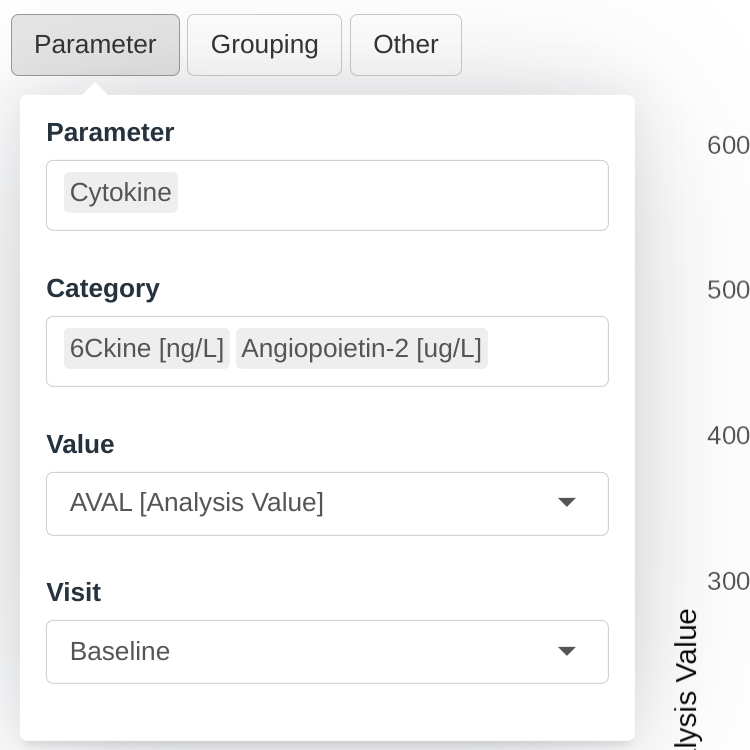
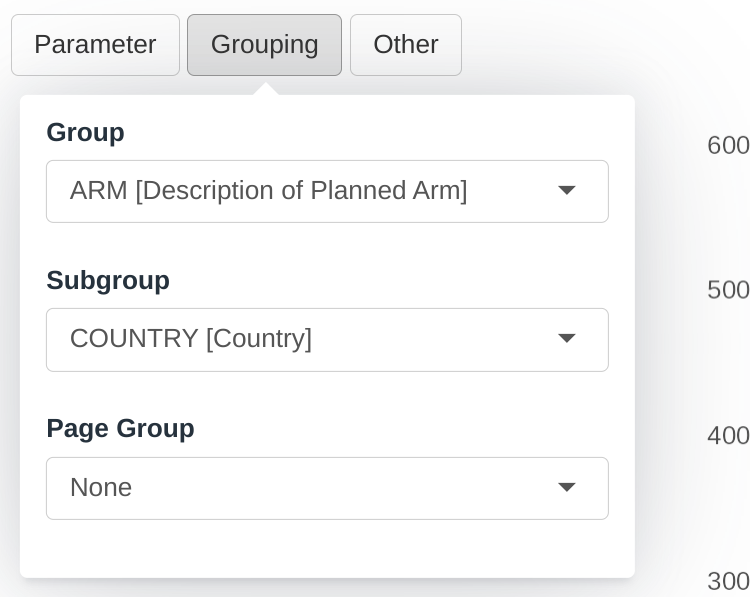
A set of menus allows to select a set of parameters, groupings and settings of the visualization.
Tables
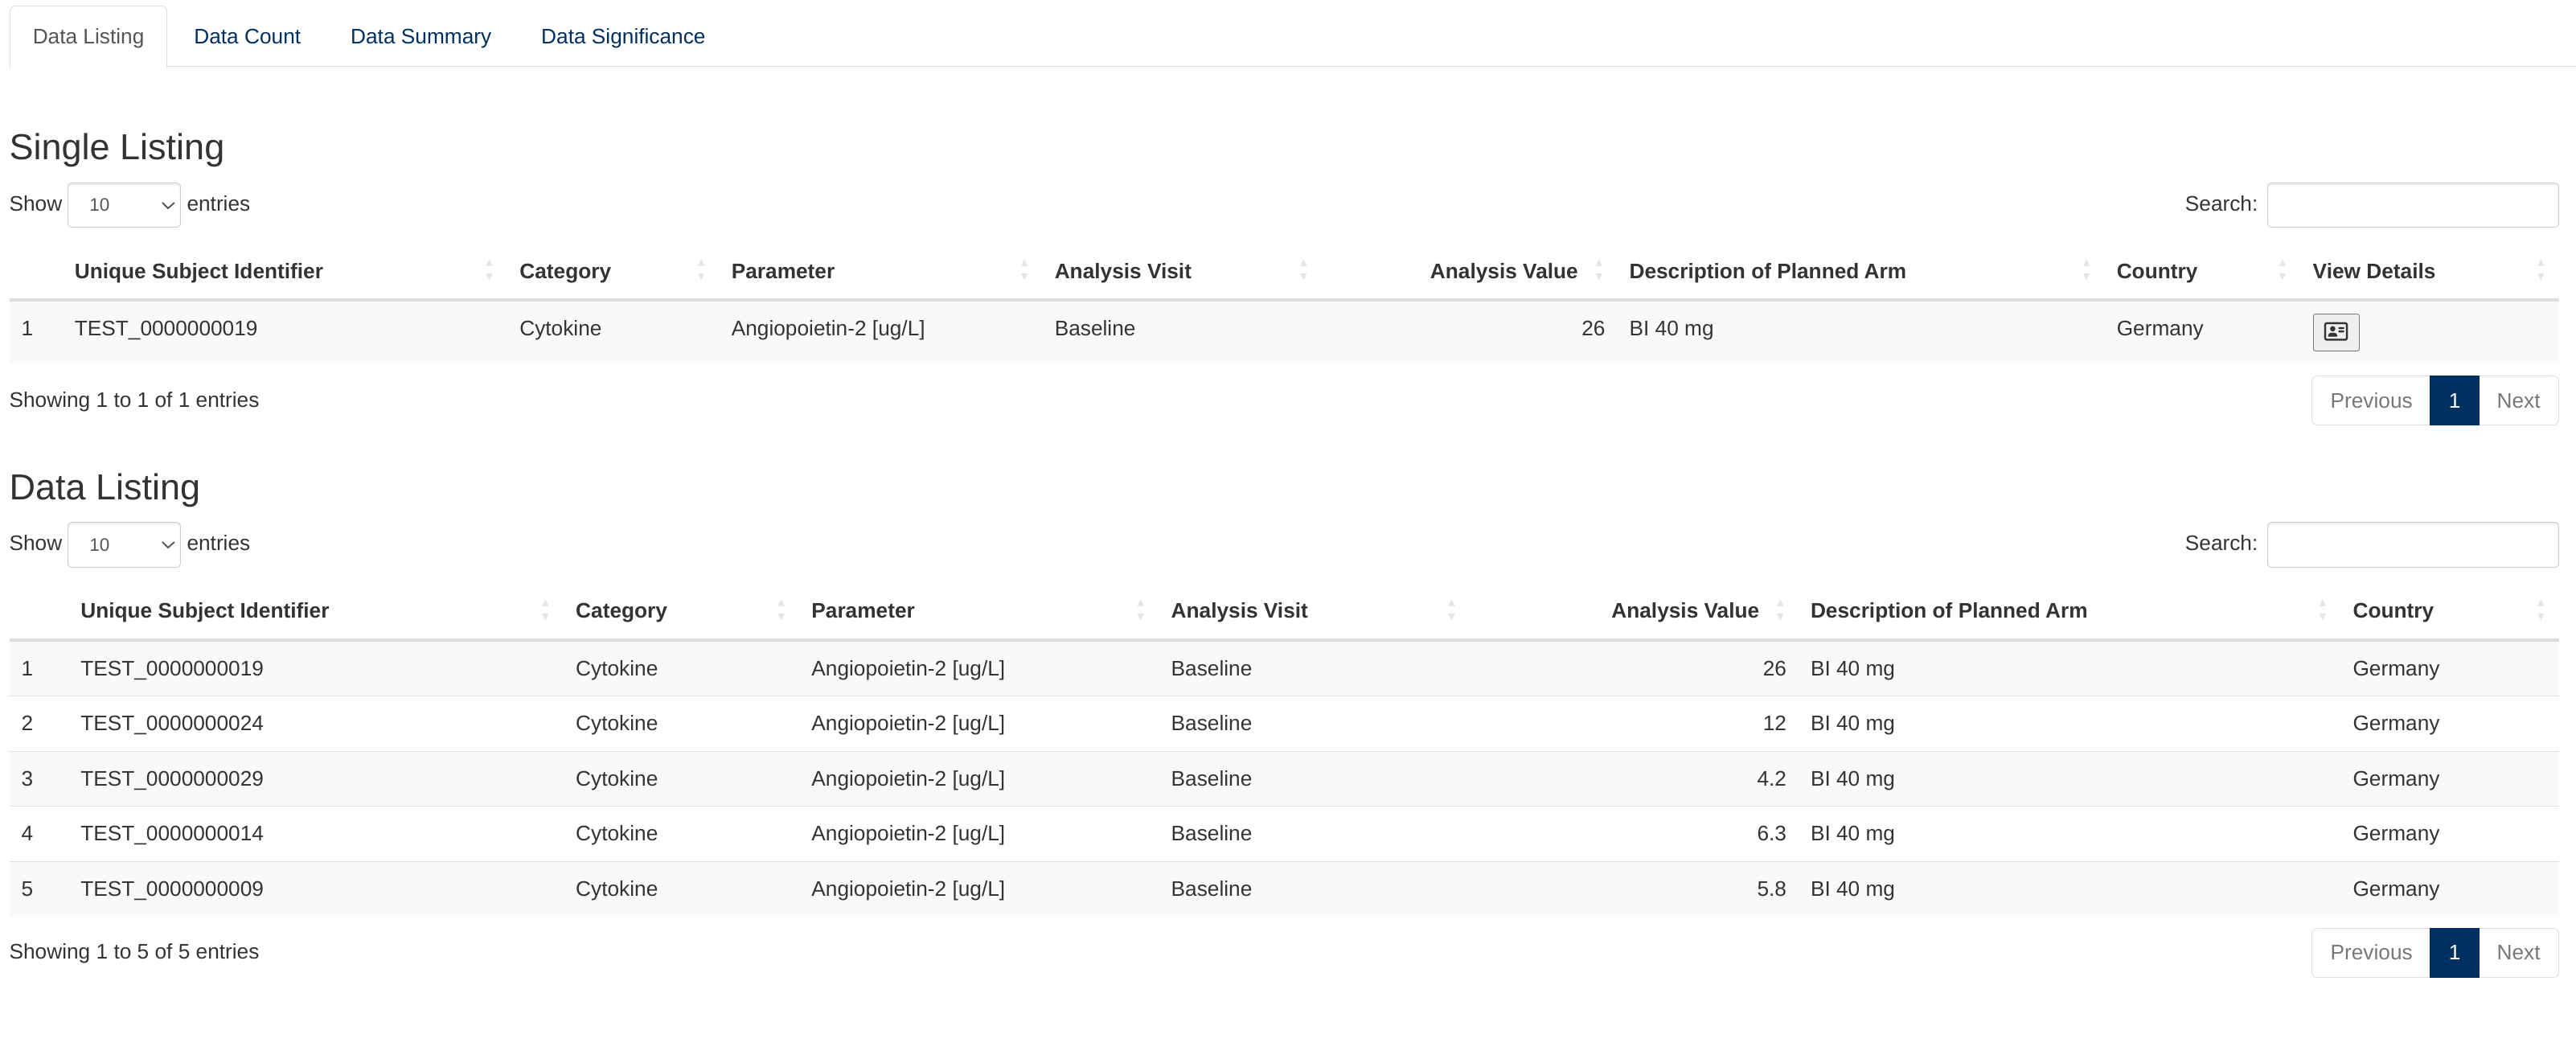
Population listing and single listing
A table containing a listing of the population of a single boxplot selected by clicking, and a table containing a single subject selected by double clicking on an individual data point in the boxplot.
The single subject table contains a drill down button that can be used to obtain more information about the subject. This setting requires additional configuration.
Creating a boxplot application
adbm_dataset <- dv.explorer.parameter:::safety_data()[["bm"]]
adsl_dataset <- dv.explorer.parameter:::safety_data()[["sl"]]

dv.manager::run_app(
  data = list(dummy = list(adbm = adbm_dataset, adsl = adsl_dataset)),
  module_list = list(
    Boxplot = dv.explorer.parameter::mod_boxplot(
      "boxplot",
      bm_dataset_name = "adbm",
      group_dataset_name = "adsl",
      cat_var = "PARCAT1",
      par_var = "PARAM",
      value_vars = c("AVAL", "CHG"),
      visit_var = "AVISIT",
      subjid_var = "USUBJID"
    )
  ),
  filter_data = "adsl",
  filter_key = "USUBJID"
)