Waterfall plus heatmap module
wfphm.Rmd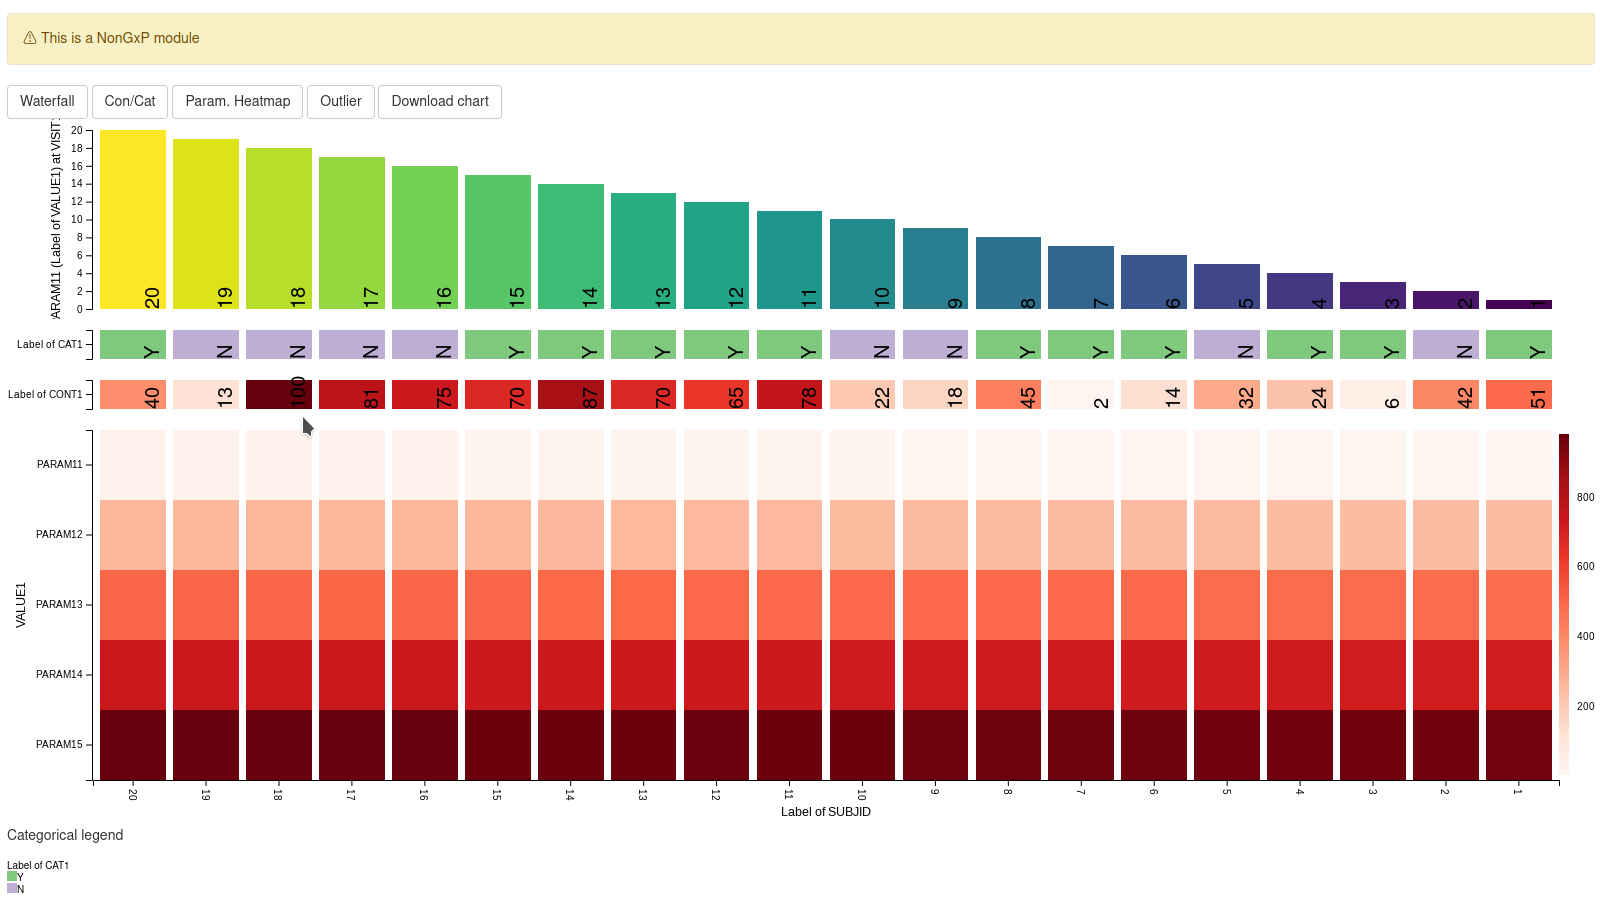
This guide provides a detailed overview of the Waterfall plus Heatmap (WfpHm) module and its features. It is meant to provide guidance to App Creators on creating Apps in DaVinci using the WfpHm module. Walk-throughs for sample app creation using the module are also included to demonstrate the various module specific features.
The WfpHm module makes it possible to visualize an appropriate variable of choice in a waterfall plot(bar chart sorted in descending order of the visualized variable from left to right) and simultaneously visualize one or more additional variables in different heat-maps that share the same common X-Axis with the Waterfall plot. This allows a user to find relations between the variables represented in the waterfall plot and the heatmaps to look for patterns.
Pre-requisite:
 “Parameter”
Term Disambiguation
“Parameter”
Term Disambiguation
The guide uses the term “parameter” at several places. This term in the guide represents clinical analysis parameters and values such as laboratory values, safety values, etc as used in the clinical dataset context. This can be confused with the word parameter as used in a programming context - “parameters of a function”. Therefore, to fully disambiguate the usage in this guide:
- Parameter is used exclusively in the clinical dataset context
- Argument is used to represent parameter of a function in the programming context
Features
WfpHm features the following four different plots:
- A waterfall plot
- A categorical heatmap
- A continuous heatmap
- A parameter heatmap
The intended usage of the plot is to find relations between a variable represented in the waterfall plot and the heatmaps.
The main feature of the module is the order of the variable values in
the X axis which is common and shared across all plots.
The order is determined based on the variable visualized in the
waterfall plot starting from left with the one having the largest value
for the variable in the waterfall plot. The variable on the X-Axis is
based on the value specified for the “subjid_var" argument
for the module. Typically it is expected to be”Subject ID” and hence the
naming convention for the argument reflects this and the default value
for the argument is set to “SUBJID”. However please note that the module
will support other suitable variables on the X-Axis as well if it is
specified as the argument value.
The variable visualized in the waterfall plot can be changed dynamically as the module allows the user to select it from the available variables in the dataset. By selecting different variables one can observe if the rest of the plots follow a particular pattern.
Mandatory Arguments for the module
[dv.explorer.parameter::mod_wfphm()] module uses several arguments with the following two being mandatory and the rest optional. Some of the optional As part of app creation, the app creator should specify the values for these arguments as applicable.
Mandatory Arguments
module_id: A unique identifier of type character for the module in the app.-
bm_dataset_name: The name of dataset contains the variables to be displayed on the waterfall and parameter heatmap plots in the WfpHm module. The dataset should at least have the columns with names specified for the cat_var, par_var, value_vars, visit_var and subjid_var optional arguments. The default values for these optional arguments if not specified are defined below.-
cat_var: “PARCAT1” -
par_var: “PARAM” -
value_vars: One or more columns with names “AVAL” or “CHG” or “PCHG” or “log2AVAL” or “log2CHG” or “log2PCHG” or “log10AVAL” or “log10CHG”, “log10PCHG” -
visit_var: “AVISIT” -
subjid_var: “SUBJID”
-
-
group_dataset_name: The name of dataset used to define groups in the waterfall plot and the variables to be displayed in the continuous and categorical heatmaps.The dataset should at least have the columns with names:
-
subjid_var: “SUBJID”
-
Refer to dv.explorer.parameter::mod_wfphm() for the
complete list of arguments and their description.
Input dataset
The mod_wfphm module is designed to work with ADaM
Basic Data Structure (BDS) using PARAMCD. The default values of
arguments for the module matches the naming of this standard
dataset.
Nonetheless:
- Other names can also be specified in the arguments of the module. So the module can work with other datasets with similar data structures but having different names.
- Not all columns in the mentioned data structure are compulsory. Refer to the “Mandatory Arguments” section above for details on the columns that are compulsory.
Example dataset
We will be using a simple dataset defined below for most of our examples to illustrate the basic features of the module. More complex ones will be created in the later part of the guide to describe additional features of the module.
This example datasets includes only a subset of the columns from the ADaM standard dataset mentioned above.
example_dataset <- list(
  "adbm" = tibble::tibble(
    SUBJID = factor(c(1, 1, 2, 2, 3, 3)),
    PARCAT1 = factor(c("PC1", "PC2", "PC1", "PC2", "PC1", "PC2")),
    PARAM = factor(c("P1", "P2", "P1", "P2", "P1", "P2")),
    AVISIT = factor(c("V1", "V2", "V1", "V2", "V2", "V1")),
    AVAL = c(11, 12, 21, 22, 31, 3)
  ),
  "adsl" = tibble::tibble(
    SUBJID = factor(c(1, 2, 3)),
    WEIGHT = c(10, 20, 30),
    SEX = factor(c("M", "F", "U")),
    COUNTRY = factor(c("DE", "US", "DE"))
  )
)
DT::datatable(example_dataset[["adsl"]], rownames = FALSE)
DT::datatable(example_dataset[["adbm"]], rownames = FALSE)Module Features using Example
An app containing only the WfpHm module can be created using the below code. The example dataset created above is used as the input dataset for this app.
module_list <- list(
  "WFPHM" = dv.explorer.parameter::mod_wfphm(
    module_id = "wfphm",
    bm_dataset_name = "adbm",
    group_dataset_name = "adsl",
    subjid_var = "SUBJID"
  )
)

dv.manager::run_app(
  data = list(DS = example_dataset),
  module_list = module_list,
  filter_data = "adsl",
  filter_key = "SUBJID"
)
Menus
Each plot in the module is driven by selections made under the corresponding menu at the top. Various options to select the variables to be plotted are available from the menu.
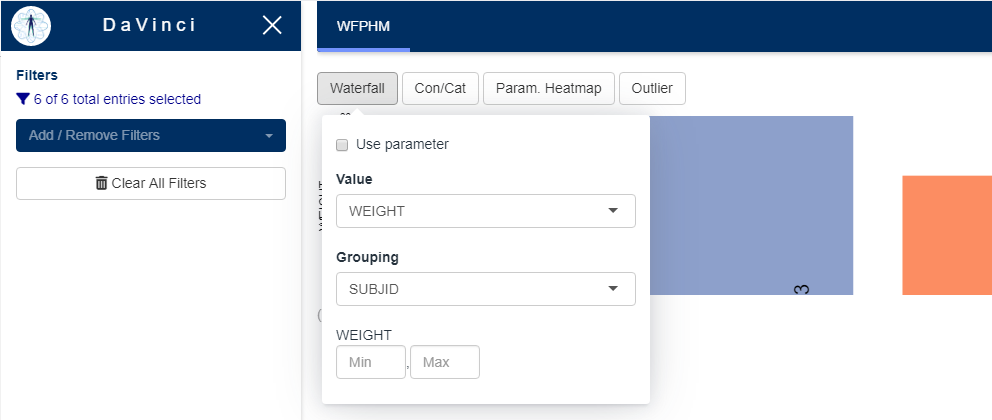
Menus in this module are data-driven when possible, this means that their content changes depending on the content of the dataset.
Let’s review each plot and its respective menu to see what are their contents and how they relate to the dataset.
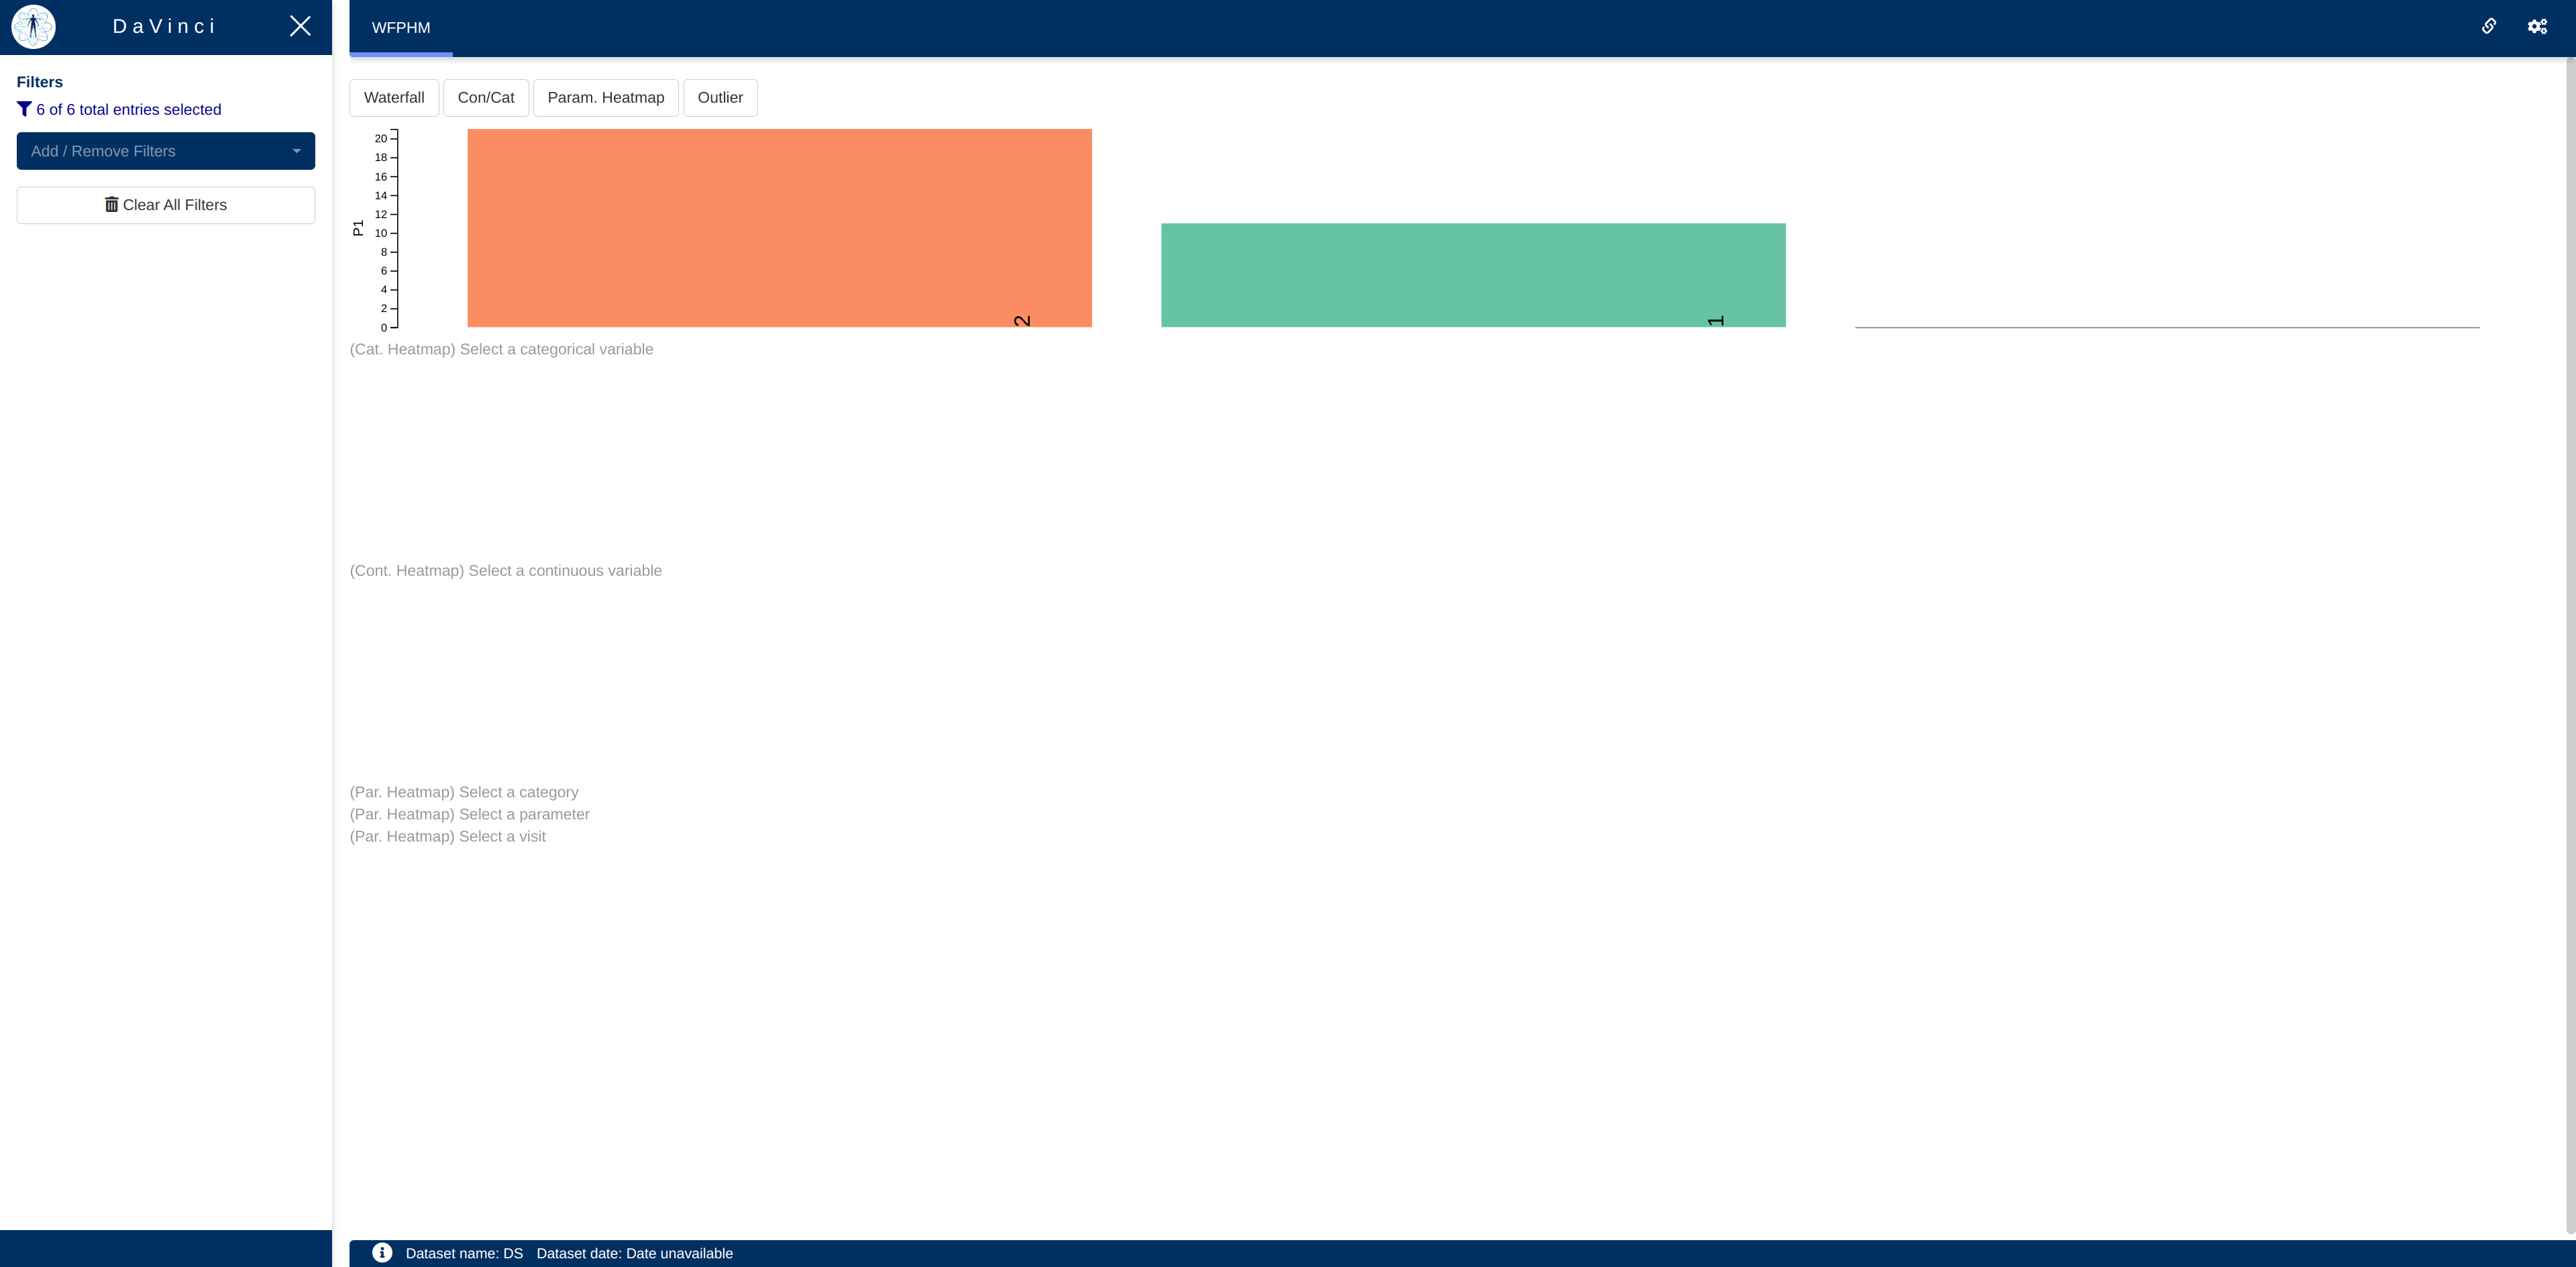
Waterfall plot
This plot shows a bar chart representing the value of a variable per subject in the adbm dataset in descending order, at a particular visit. The variable shown in the plot is selected from the waterfall menu option.
Plotting parameters
The ADaM Basic Data Structure (BDS) using PARAMCD is used to store parameter values for a given subject across several visits. Any of these parameters can be selected to be plotted in the waterfall.
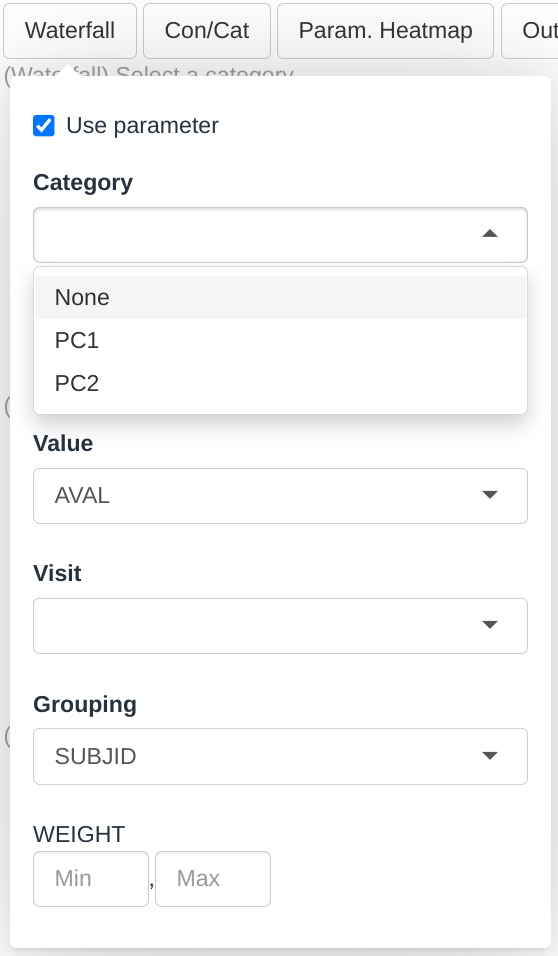
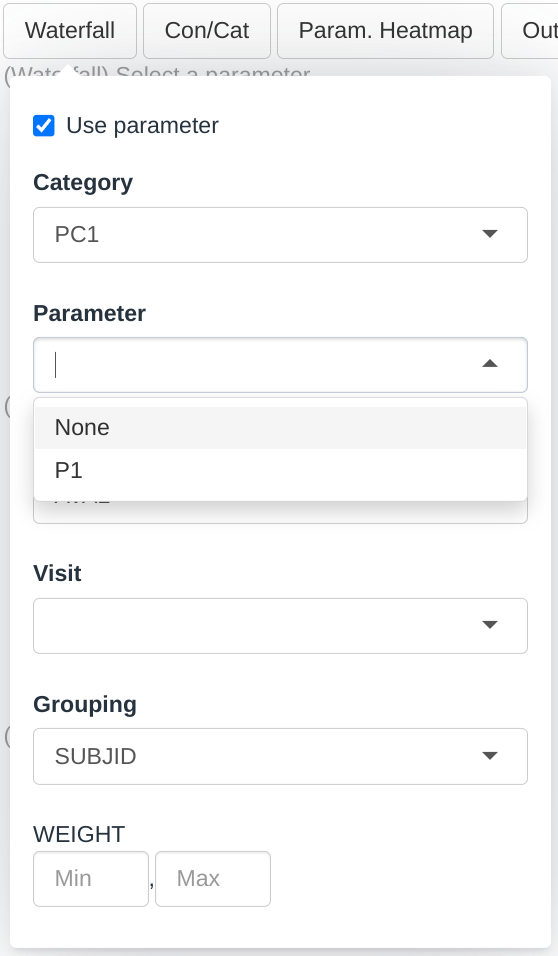
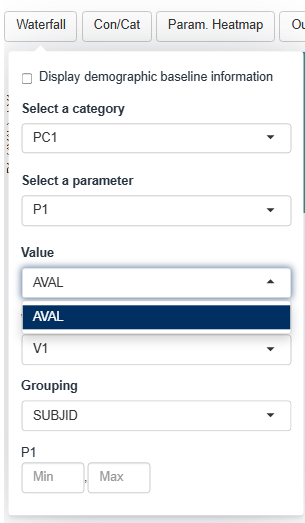
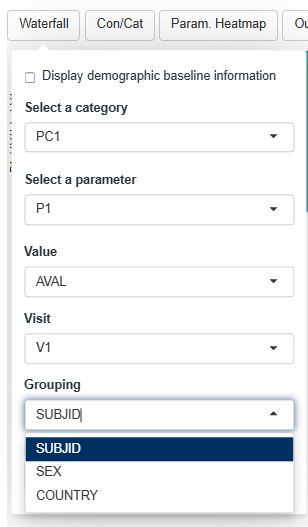
Dropdown menus for this plot are filled up the following way:
- The Category dropdown will contain all the factor levels in the PARCAT1 column.
- The Parameter dropdown will contain all the factor levels in the PARAM column whose corresponding PARCAT1 is selected in the Category menu.
- The Value dropdown will contain a subset of the numerical columns in the dataset. We will cover this menu in a subsequent section.
- The Visit dropdown will contain all the factor levels in the AVISIT column.
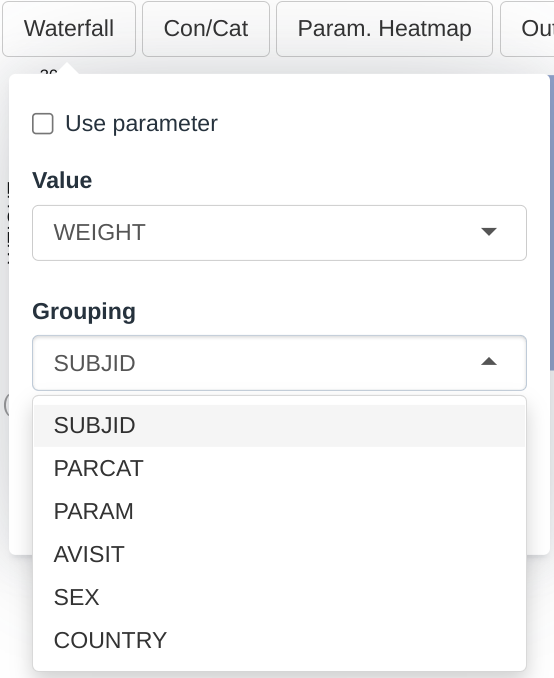
- The Grouping dropdown will contain all the columns in the group dataset that are categorical
According to the selections made in the screenshot:
- The height of the bar will represent the value of:
- the P1 parameter which is listed under the PC1 category
- as listed in the AVAL column
- for the visit V1
- for each participant
- Each bar is colored and labelled according to the SUBJID
Plotting demographic baseline information
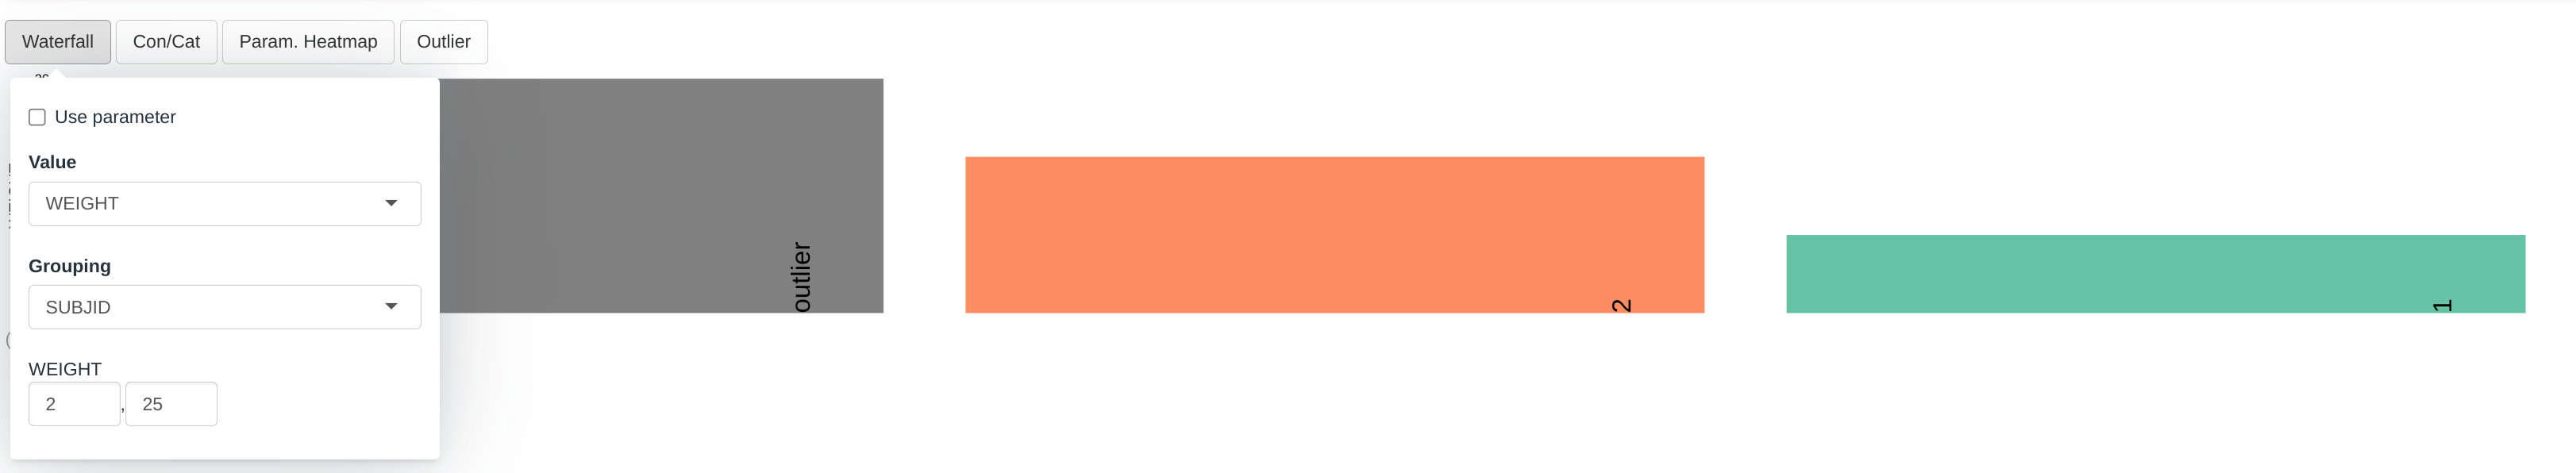
It is also possible to plot subject level / demographic data. To do so the “Display demographic baseline information” check box in the menu should be checked.
Dropdown menus for this plot are filled up the following way:
- The Value dropdown will contain all the columns in the bm dataset that are numerical
- The Grouping dropdown will contain all the columns in the group dataset that are categorical
As per the selections made in the screenshot above:
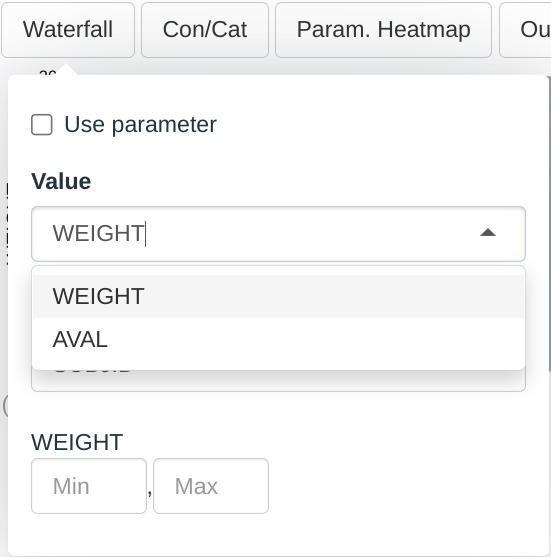
- The height of the bar in the chart represent the value of the WEIGHT variable for each participant
- Each bar is colored and labelled according to the SUBJID. We can change this selection for a more meaningful one, for example COUNTRY
The Value Dropdown
Plotting parameters requires selecting the numerical columns that represent the parameter values, usually AVAL represents the raw value. But deriving new values is quite common for example Change from Baseline or transformation of the value such as logarithms.
By default, the module have a list of common parameter value columns
that, if present in the dataset, will appear in the menu (e.g.: “AVAL”,
“CHG” or “PCHG”. See dv.explorer.parameter::wfphm_server
for a full list)
But if a custom column is derived we can modify the call to the module so it is included in the menu as seen in the example below.
# Lets create a new custom
example_dataset_custom_aval <- example_dataset
example_dataset_custom_aval[["adbm"]][["CUSTOM_AVAL"]] <- example_dataset_custom_aval[["adbm"]][["AVAL"]] + 100

module_list_custom_aval <- list(
  "WFPHM" = dv.explorer.parameter::mod_wfphm(
    module_id = "wfphm",
    value_vars = c("CUSTOM_AVAL"), # We have added this argument
    bm_dataset_name = "adbm",
    group_dataset_name = "adsl",
    subjid_var = "SUBJID"
  )
)
dv.manager::run_app(
  data = list(DS = example_dataset_custom_aval),
  module_list = module_list_custom_aval,
  filter_data = "adbm",
  filter_key = "SUBJID"
)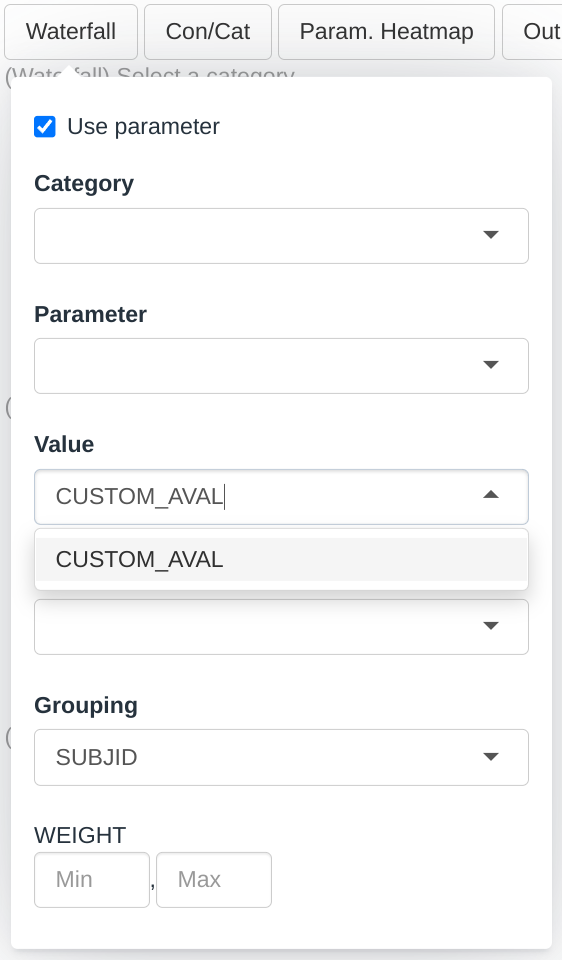
The new argument in the module call indicates that CUSTOM_AVAL is a column that contains values associated to parameters and is therefore included in the menu. The previous AVAL no longer appear in the menu, that happens because specifying a new column overrides the default columns. If one is specified then all should be specified.
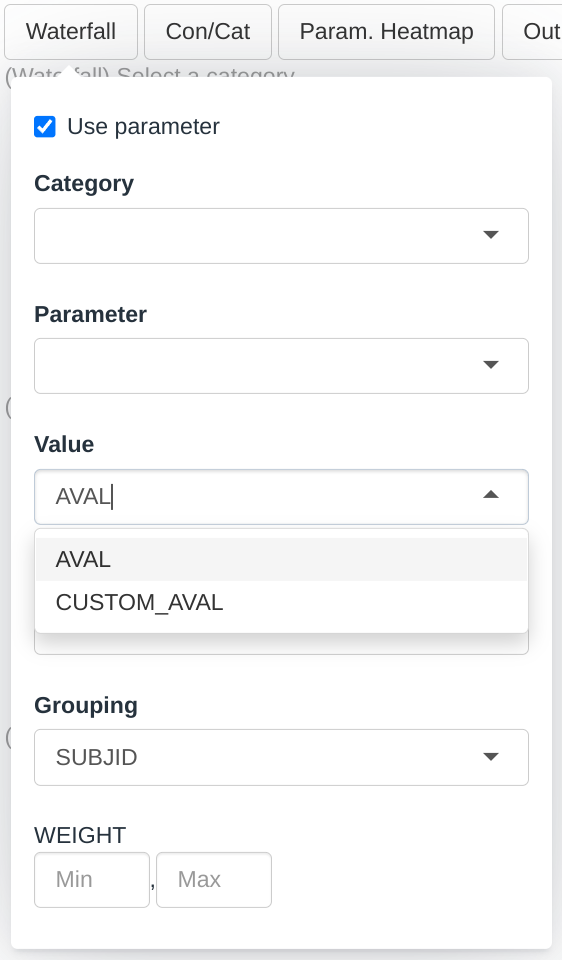
module_list_custom_aval <- list(
  "WFPHM" = dv.explorer.parameter::mod_wfphm(
    module_id = "wfphm",
    value_vars = c("AVAL", "CUSTOM_AVAL"), # We have added this argument
    bm_dataset_name = "adbm",
    group_dataset_name = "adsl",
    subjid_var = "SUBJID"
  )
)

dv.manager::run_app(
  data = list(DS = example_dataset_custom_aval),
  module_list = module_list_custom_aval,
  filter_data = "adbm",
  filter_key = "SUBJID"
)
Outliers menu
At the bottom of the waterfall menu we can define which values are considered outliers. The outliers will be colored in gray and labelled accordingly.
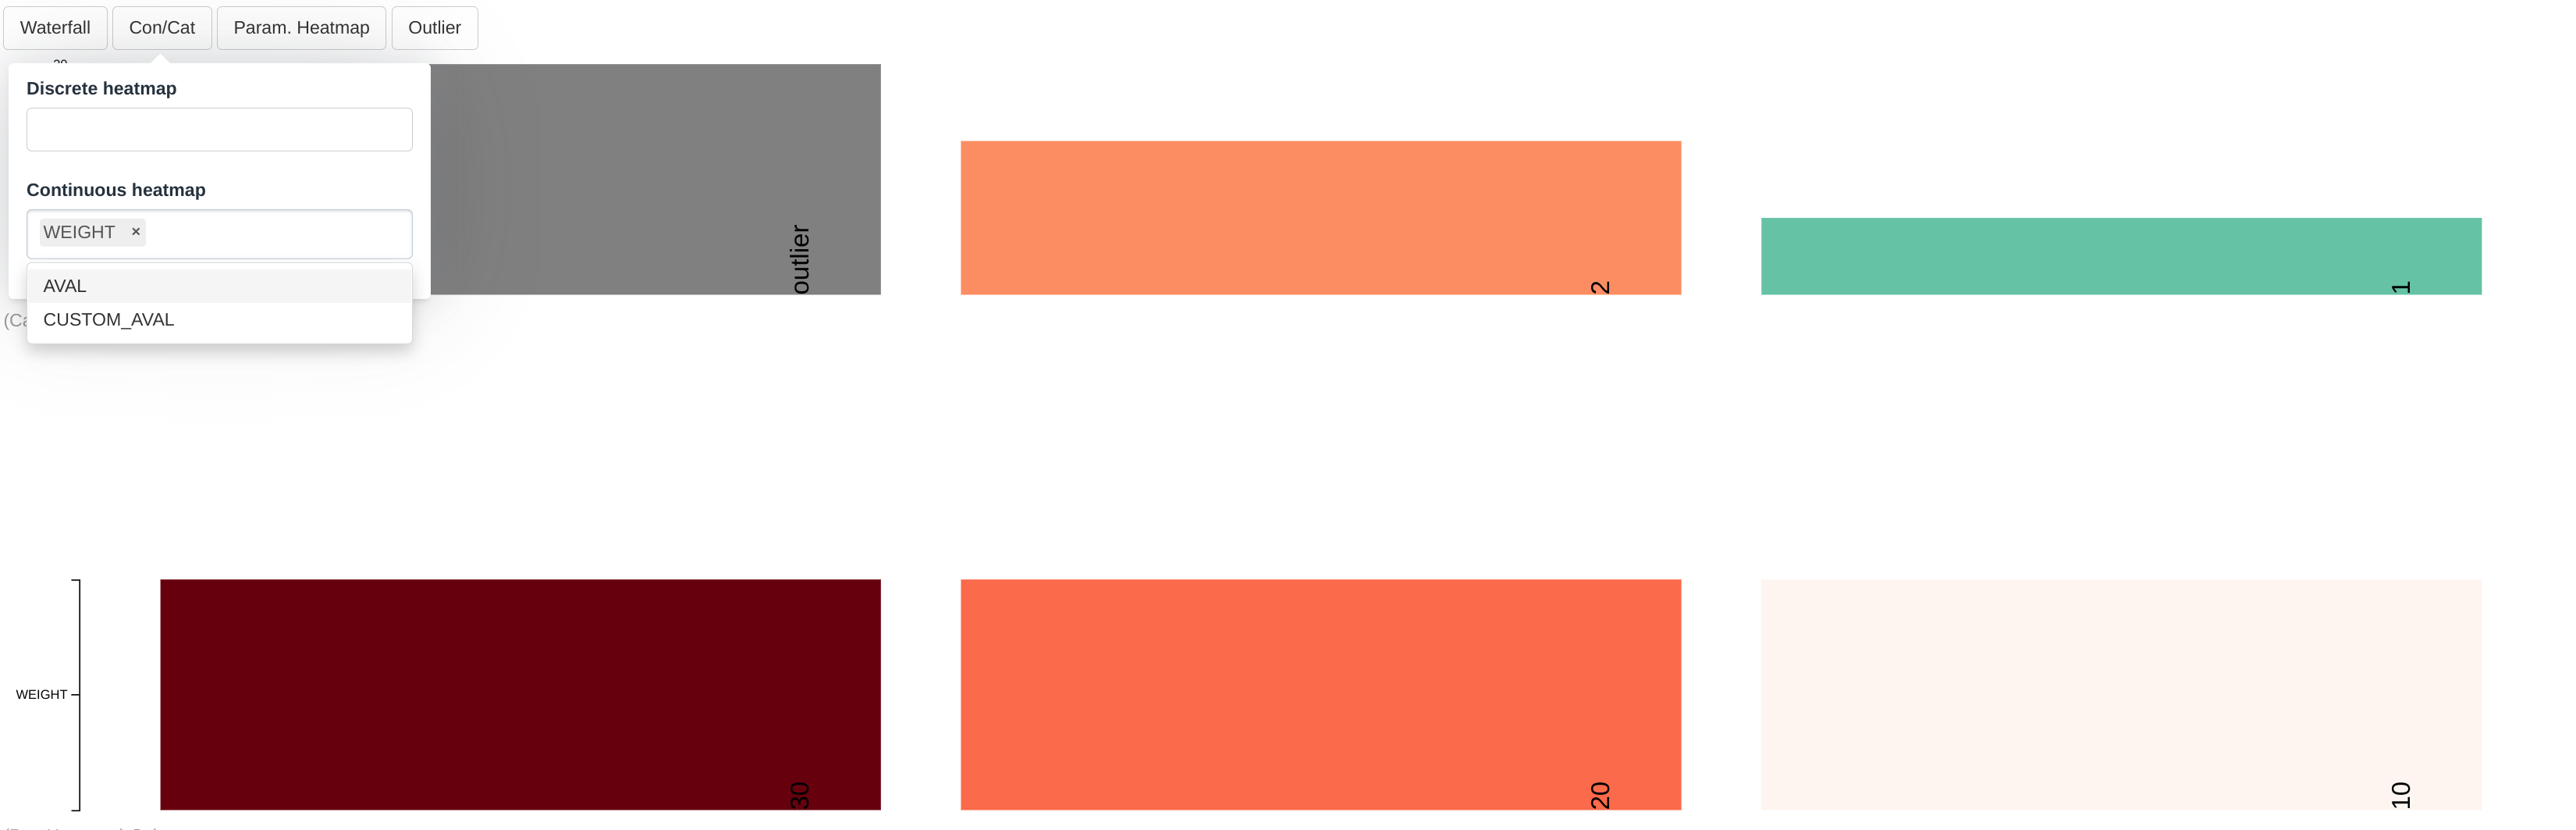
Continuous and categorical heatmap
The two plots immediately below the waterfall plot are the categorical and a continuous heatmaps.
Categorical heatmap
Dropdown menu is filled up the following way:
- The Categorical dropdown will contain all the columns in the group dataset that are categorical
As per the selections made in the screenshot:
- In the first row the value of the column SEX for each participant is displayed where each cell is labelled and colored accordingly.
- In the second row the value of the column COUNTRY for each participant is displayed where each cell is labelled and colored accordingly.
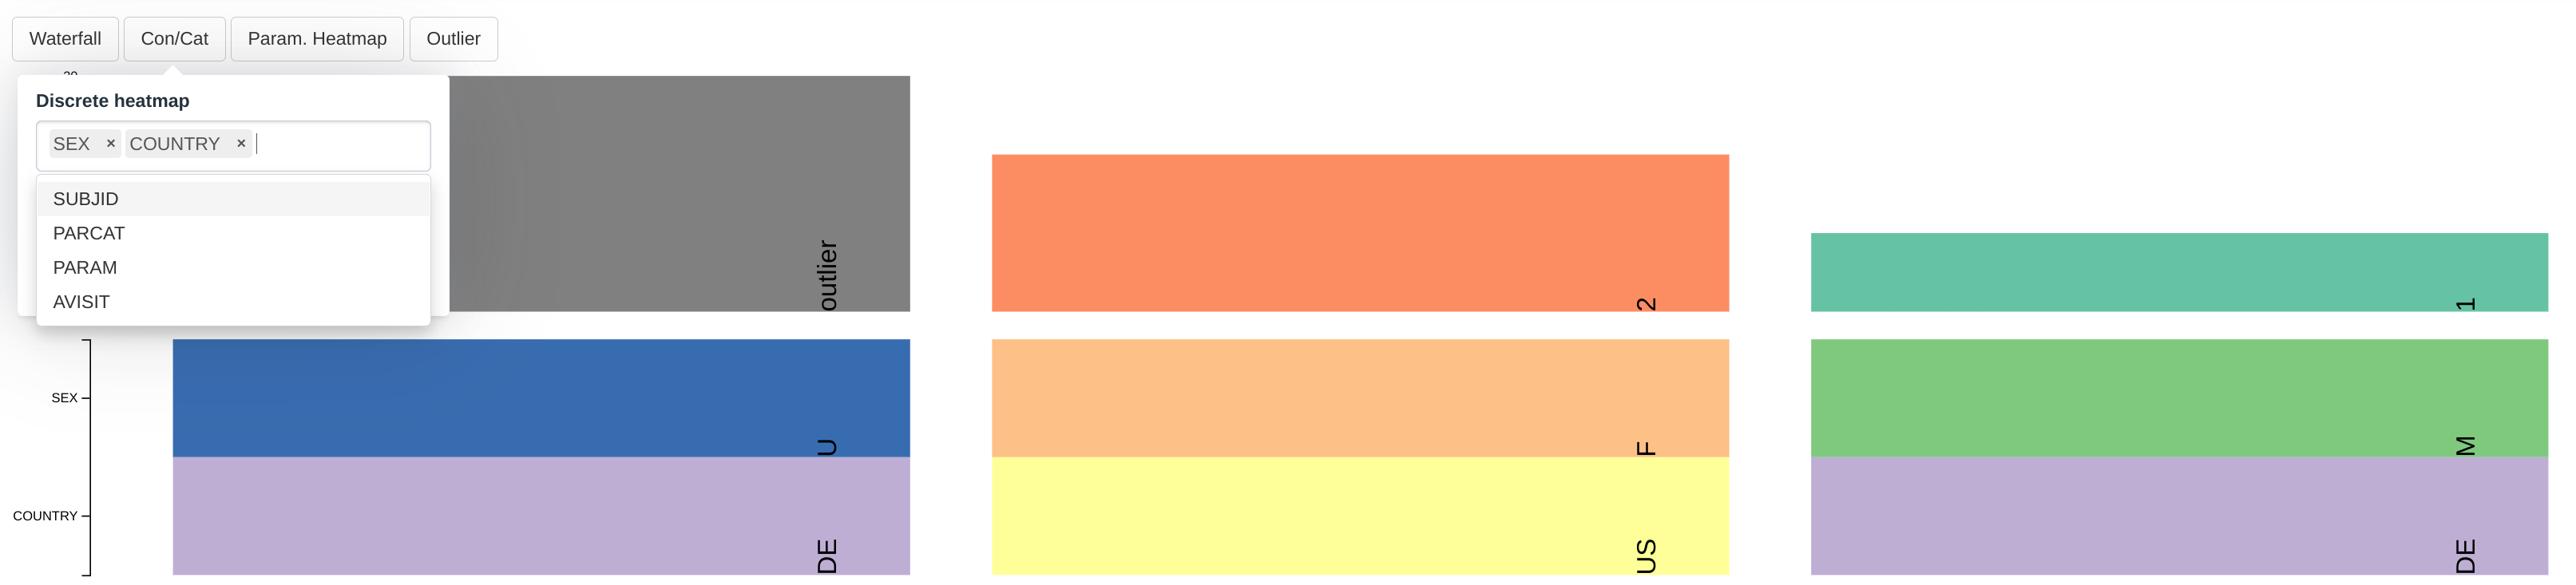
Continuous heatmap
Dropdown menus is filled up the following way:
- The Continuous dropdown will contain all the columns in the group dataset that are numerical
As per the selections made in the screenshot:
- In the first row the value of the column WEIGHT for each participant is displayed where each cell is labelled and colored accordingly
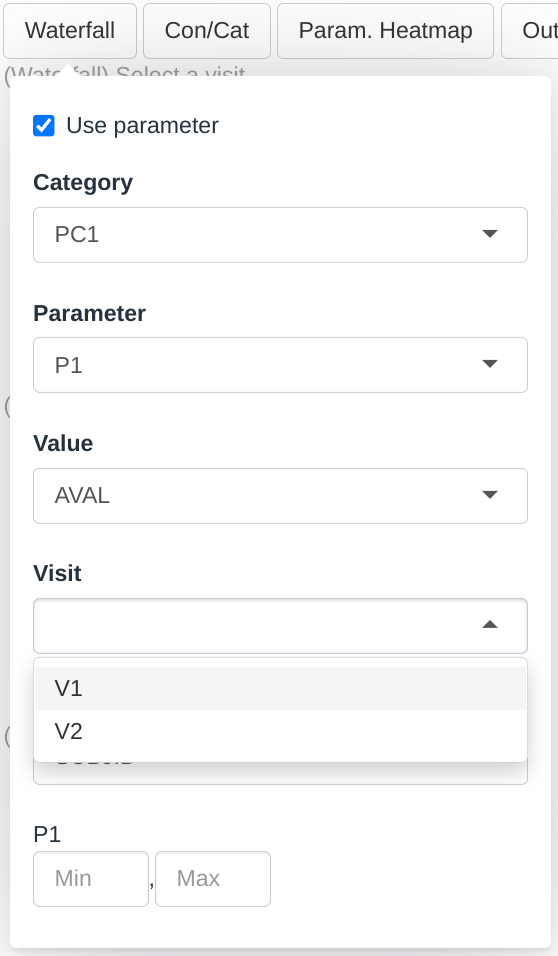
Parameter heatmap
The last plot is the parameter heatmap that plots a heatmap where the rows represent different parameters.
The menus in this plot follow similar rules to those presented in the Plotting Parameter section in the Waterfall plot with the difference that the Category and Parameter menus now accept selecting multiple values. The Transformation menu will be covered in a separate section below.
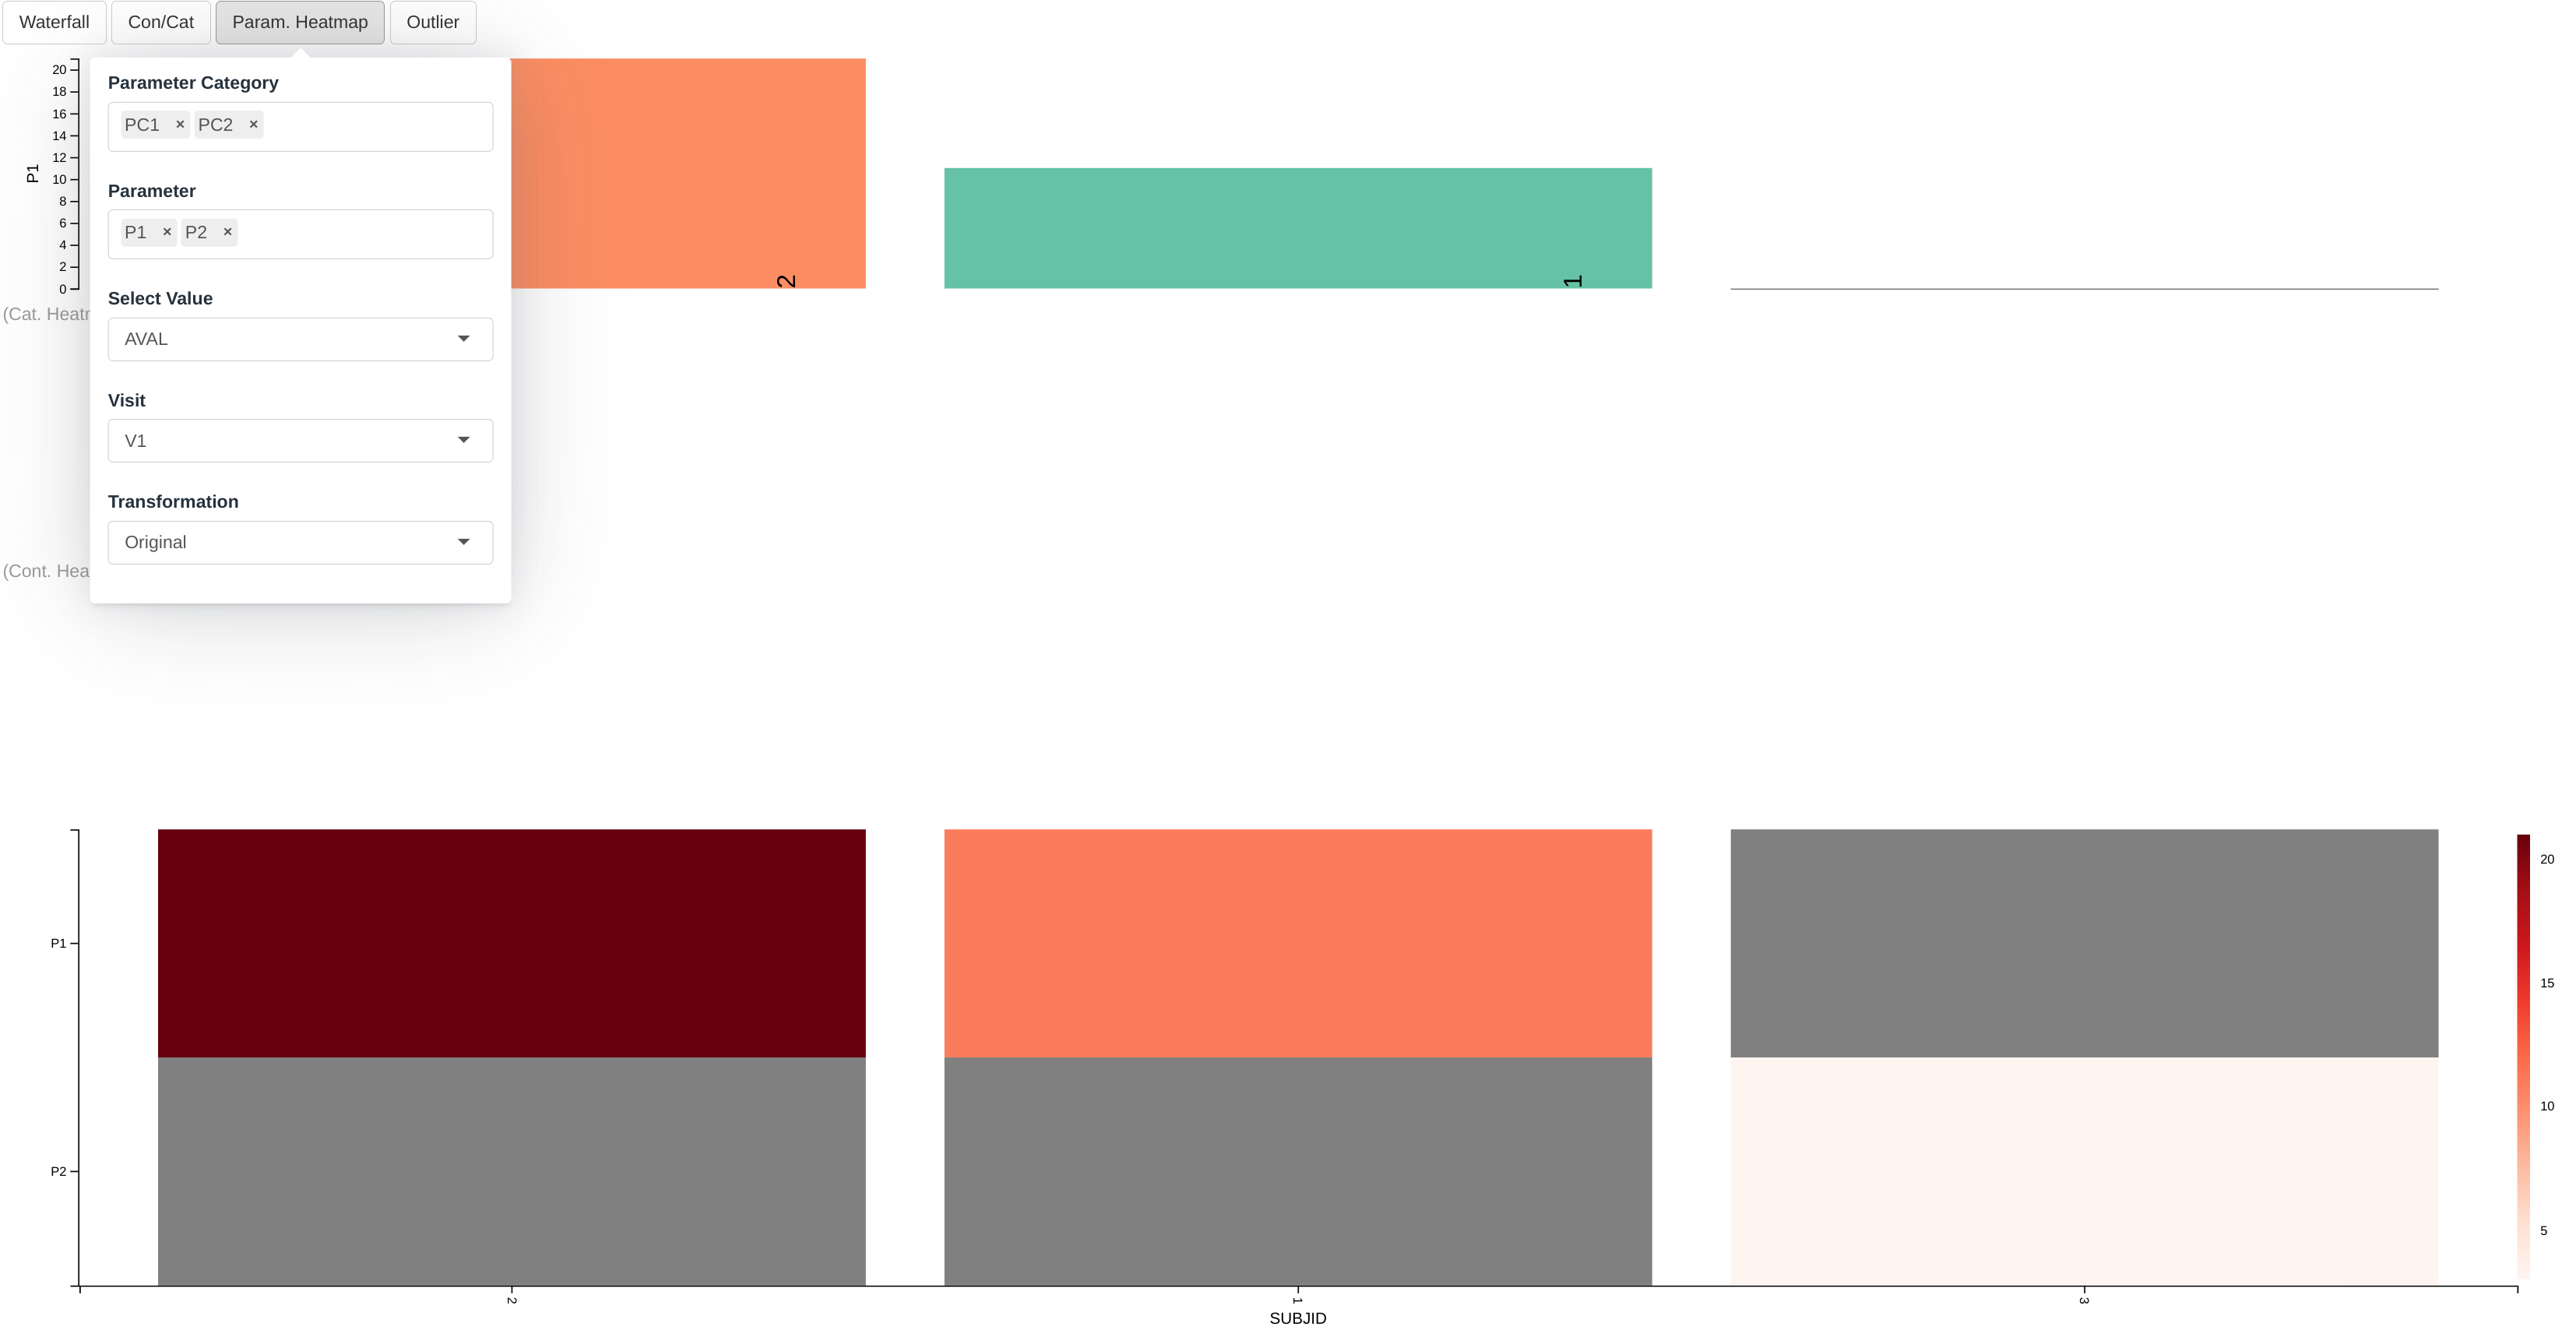
Therefore according to the present selection we are observing:
- In the first row the color of the cell represents the value of:
- the P1 parameter which is listed under the PC1 category
- as listed in the AVAL column
- for the visit V1
- for each participant
- In the second row the color of the cell represents the value of:
- the P2 parameter which is listed under the PC2 category
- as listed in the AVAL column
- for the visit V1
- for each participant
- Missing values are grayed out
Outlier menu
The parameter heatmap works similarly to that described in the Waterfall plot with the only difference that, because several parameteres can be shown in this heatmap, a different outlier range can be defined for each parameter.
The Transformation Dropdown Menu
The transformation menu offers several possible data transformation such as Z-score or Min-Max. The transformation is applied to each parameter (i.e. to each row of the heatmap) independently.
 Note Outliers definition, described in the previous
section, does not affect the calculation of the transformations
Note Outliers definition, described in the previous
section, does not affect the calculation of the transformations
![]()
By default, the module include several transformation (See
dv.explorer.parameter::wfphm_server for a full list) but
the user can include custom transformations if needed for their data.
The function is applied to each row independently, meaning the function
receives a vector with all the values from a row and it must returned a
similar vector with the transformed values.
module_list_custom_transformation <- list( # nolint
  "WFPHM" = dv.explorer.parameter::mod_wfphm(
    module_id = "wfphm",
    tr_mapper = list( # New argument
      "Original" = dv.explorer.parameter::tr_identity,
      "Mean Centered" = function(x) {
        x - mean(x)
      }
    ),
    bm_dataset_name = "adbm",
    group_dataset_name = "adsl",
    subjid_var = "SUBJID"
  )
)

dv.manager::run_app(
  data = list(DS = example_dataset),
  module_list = module_list_custom_transformation,
  filter_data = "adbm",
  filter_key = "SUBJID"
)![]()
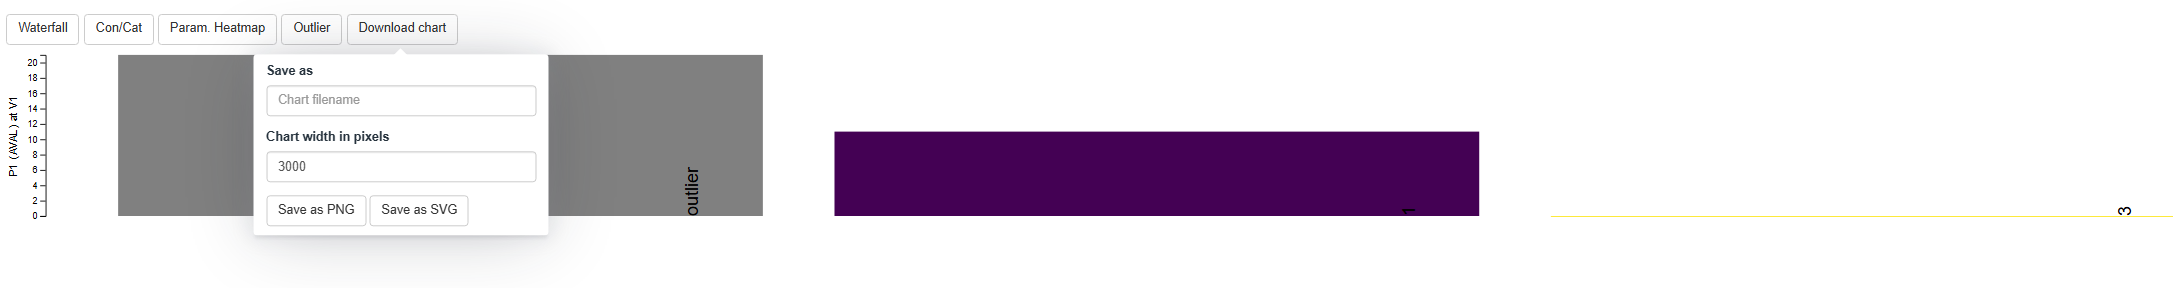
Download chart menu
The download chart menu allows to save a configuration of visualisations to your local environment, as a .png or .svg file.
Using column labels in the menus
When the menu entries reference a column in the dataset, we can decorate the entries by setting a label attribute for the columns.
# Assign some labels to the dataset
example_dataset_labelled <- example_dataset
attr(example_dataset_labelled[["adbm"]][["SUBJID"]], "label") <- "Subject ID"
attr(example_dataset_labelled[["adsl"]][["SEX"]], "label") <- "Subject Sex"
attr(example_dataset_labelled[["adbm"]][["PARCAT1"]], "label") <- "Parameter Category"

dv.manager::run_app(
  data = list(DS = example_dataset_labelled),
  module_list = module_list,
  filter_data = "adbm",
  filter_key = "SUBJID"
)
Custom column names
As mentioned described in the previous section, though this module is designed to work with ADaM Basic Data Structure (BDS) using PARAMCD, it can also be used generally with non-standard datasets that have a similar structure.
For example, consider the below example where a dataset with different column names is created and used for a app with this module. As you can notice, the non standard column names are used as the values for applicable module arguments.
adbm_dataset <- dv.explorer.parameter:::safety_data()[["bm"]]
adsl_dataset <- dv.explorer.parameter:::safety_data()[["sl"]]

module_list <- list(
  "WFPHM" = dv.explorer.parameter::mod_wfphm(
    module_id = "wfphm",
    bm_dataset_name = "adbm",
    group_dataset_name = "adsl",
    cat_var = "PARCAT1",
    par_var = "PARAM",
    visit_var = "AVISIT",
    subjid_var = "USUBJID",
    value_vars = "AVAL",
  )
)

dv.manager::run_app(
  data = list(dummy = list(adbm = adbm_dataset, adsl = adsl_dataset)),
  module_list = module_list,
  filter_data = "adsl",
  filter_key = "USUBJID" # We changed this one too, see dv.manager filtering doc for this change
)