Lineplot reference values
lineplot_reference_values.RmdThis article describes how to display reference values in
mod_lineplot charts and discusses the behavior of reference
lines in the presence of grouped data.
A basic plot
As a starting point, let’s imagine we want to inspect the following
toy subject-level (sl) and laboratory values
(lb) datasets:
Subject-level dataset [expand/collapse]
| SUBJID | SEX | RACE | COUNTRY |
|---|---|---|---|
| 1015 | F | WHITE | Italy |
| 1028 | M | WHITE | Spain |
Laboratory values dataset [expand/collapse]
| SUBJID | PARCAT1 | PARAM | AVISITN | AVAL | A1LO | A1HI |
|---|---|---|---|---|---|---|
| 1015 | CHEM | Imaginariol (mmol/L) | 0 | 5.94780 | 4.03 | 6 |
| 1015 | CHEM | Imaginariol (mmol/L) | 2 | 5.48232 | 4.03 | 6 |
| 1015 | CHEM | Imaginariol (mmol/L) | 4 | 4.99098 | 4.03 | 6 |
| 1028 | CHEM | Imaginariol (mmol/L) | 0 | 4.80996 | 3.85 | 6 |
| 1028 | CHEM | Imaginariol (mmol/L) | 2 | 4.70652 | 3.85 | 6 |
| 1028 | CHEM | Imaginariol (mmol/L) | 4 | 4.37034 | 3.85 | 6 |
We can do so by configuring mod_lineplot thus:
dv.explorer.parameter::mod_lineplot(
  module_id = "lineplot", bm_dataset_name = "lb", group_dataset_name = "sl",
  subjid_var = "SUBJID", cat_var = "PARCAT1", par_var = "PARAM",
  value_vars = "AVAL", visit_vars = "AVISITN", default_cat = "CHEM",
  default_par = "Imaginariol (mmol/L)", default_main_group = "SEX"
)
Which generates the following plot: 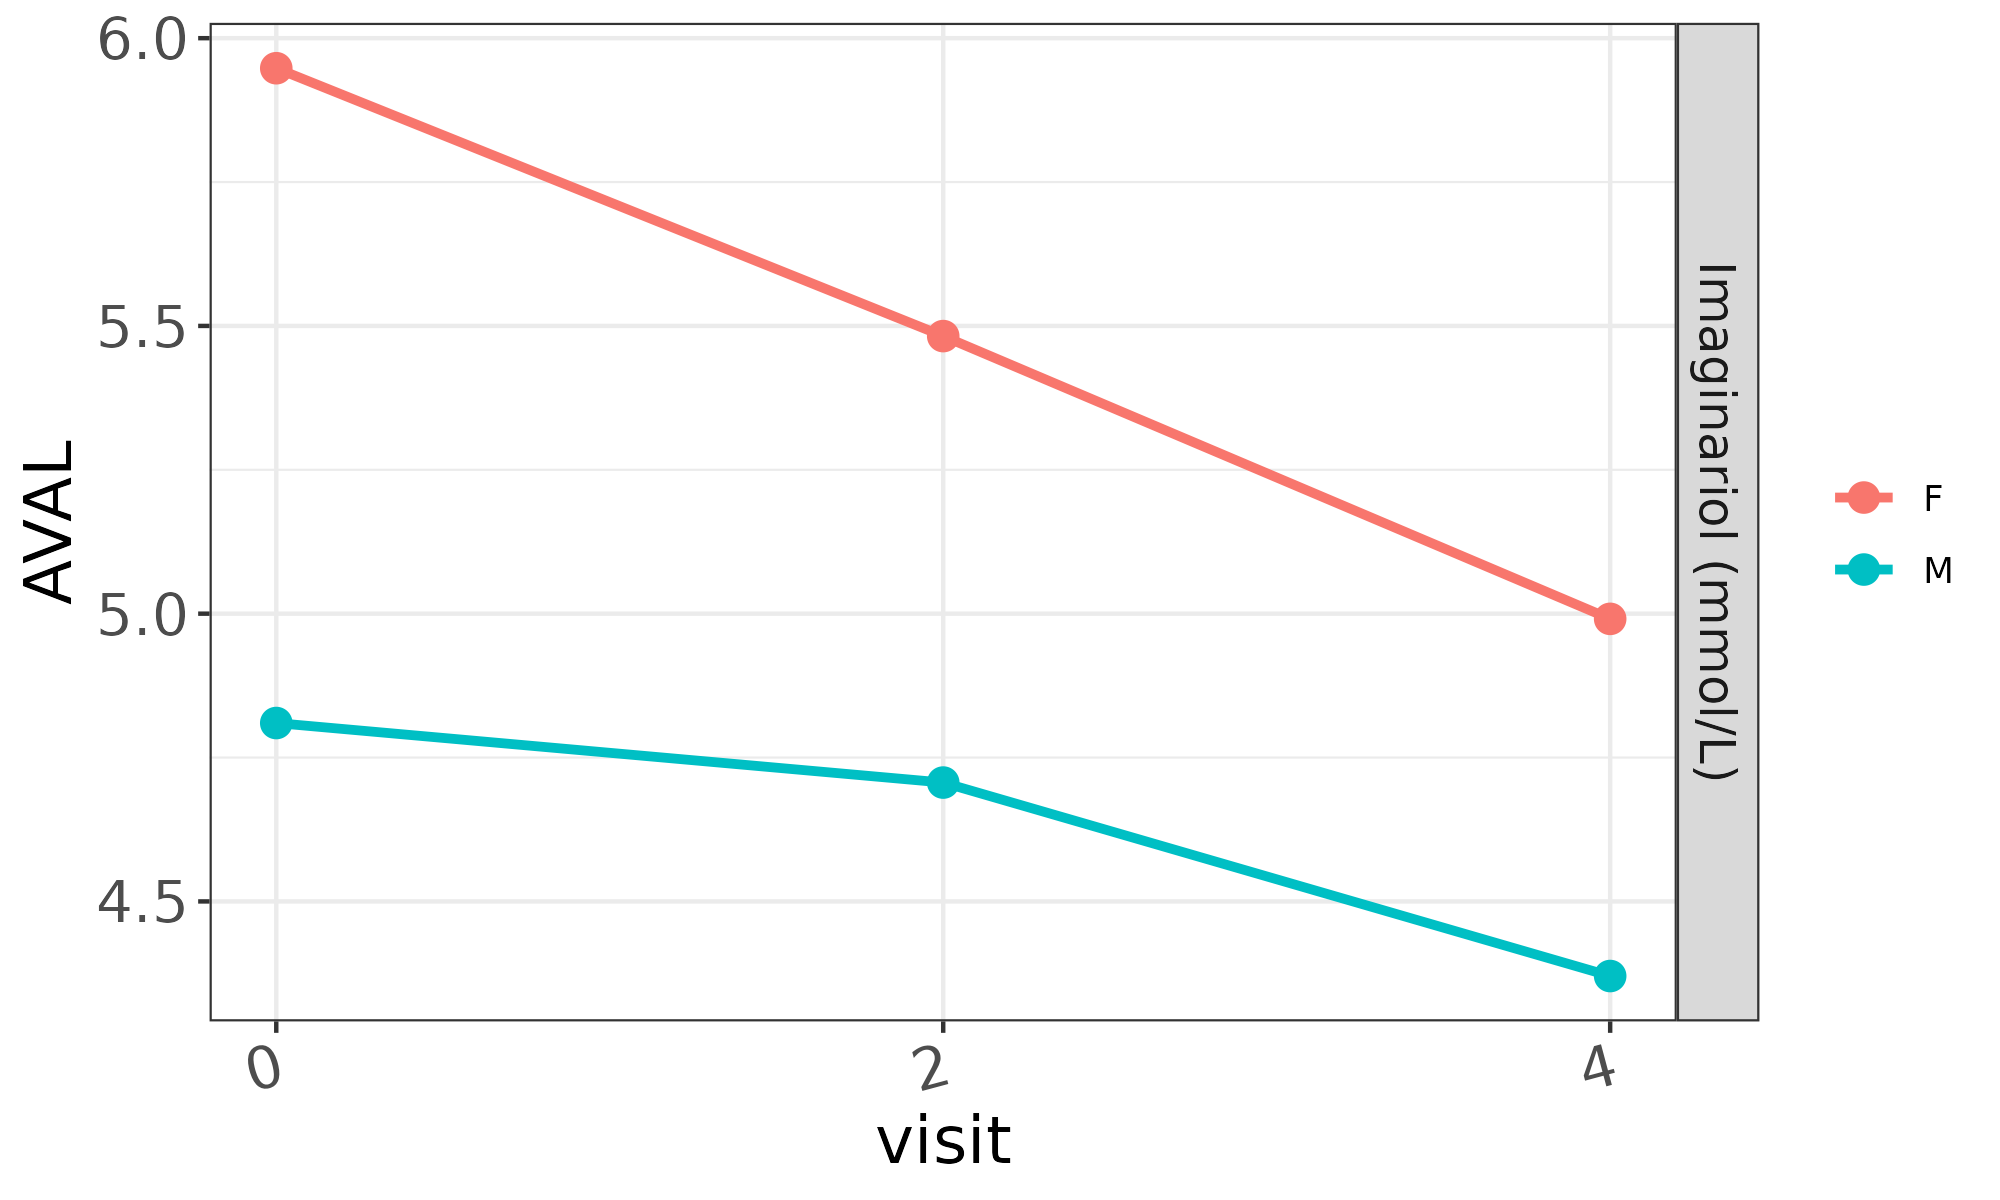
Grouped and ungrouped reference values
We can modify that call to mod_lineplot by providing a
value for the ref_line_vars parameter so that it points to
one or more lb numerical columns holding reference
values:
dv.explorer.parameter::mod_lineplot(
  ..., default_main_group = "SEX", ref_line_vars = c("A1LO", "A1HI")
)
Which produces: 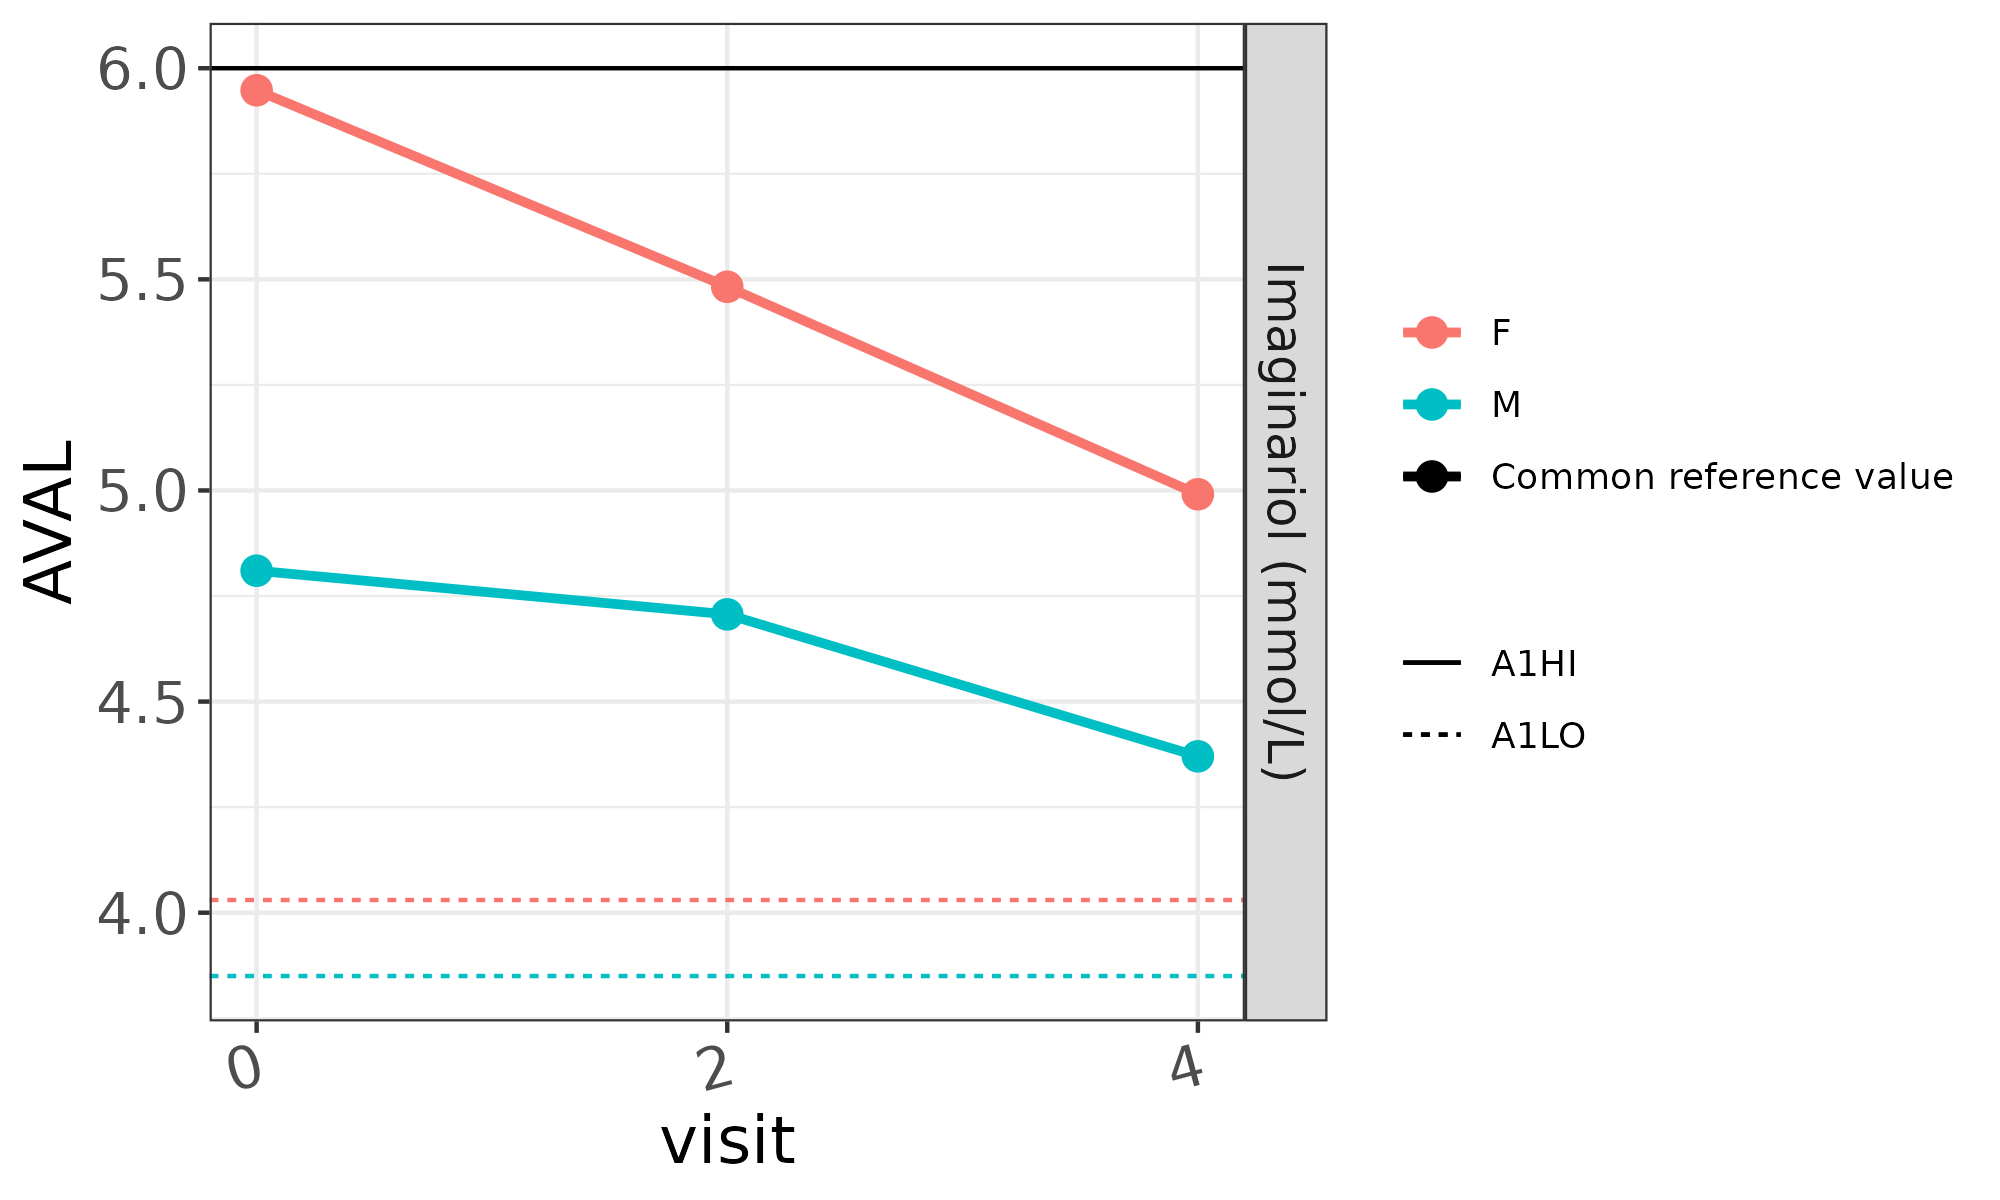 Examining this plot, we can see the three distinct reference values
available in the original
Examining this plot, we can see the three distinct reference values
available in the original bm dataset. There is one
A1HI value common to our two subjects. It’s indicated with
a continuous black line. There are also two A1LO values
that coincide with our selected grouping. Since the plot already
provides colors for the “female” and “male” categories,
mod_lineplot paints those lines in matching colors.
Which demographic variable dictates distinct reference values?
The original bm dataset does not explain which variable
leads to subjects having different A1LO reference values.
One of the two subjects has a A1LO value of 3.85 while the
other has one of 4.03. It’s likely that SEX is the variable
that justifies the difference. However, given the totality of the data,
COUNTRY would work just as well. If we change the main
grouping to COUNTRY, the plot remains the same except for
the grouping legend:
dv.explorer.parameter::mod_lineplot(
  ..., default_main_group = "COUNTRY", ref_line_vars = c("A1LO", "A1HI")
)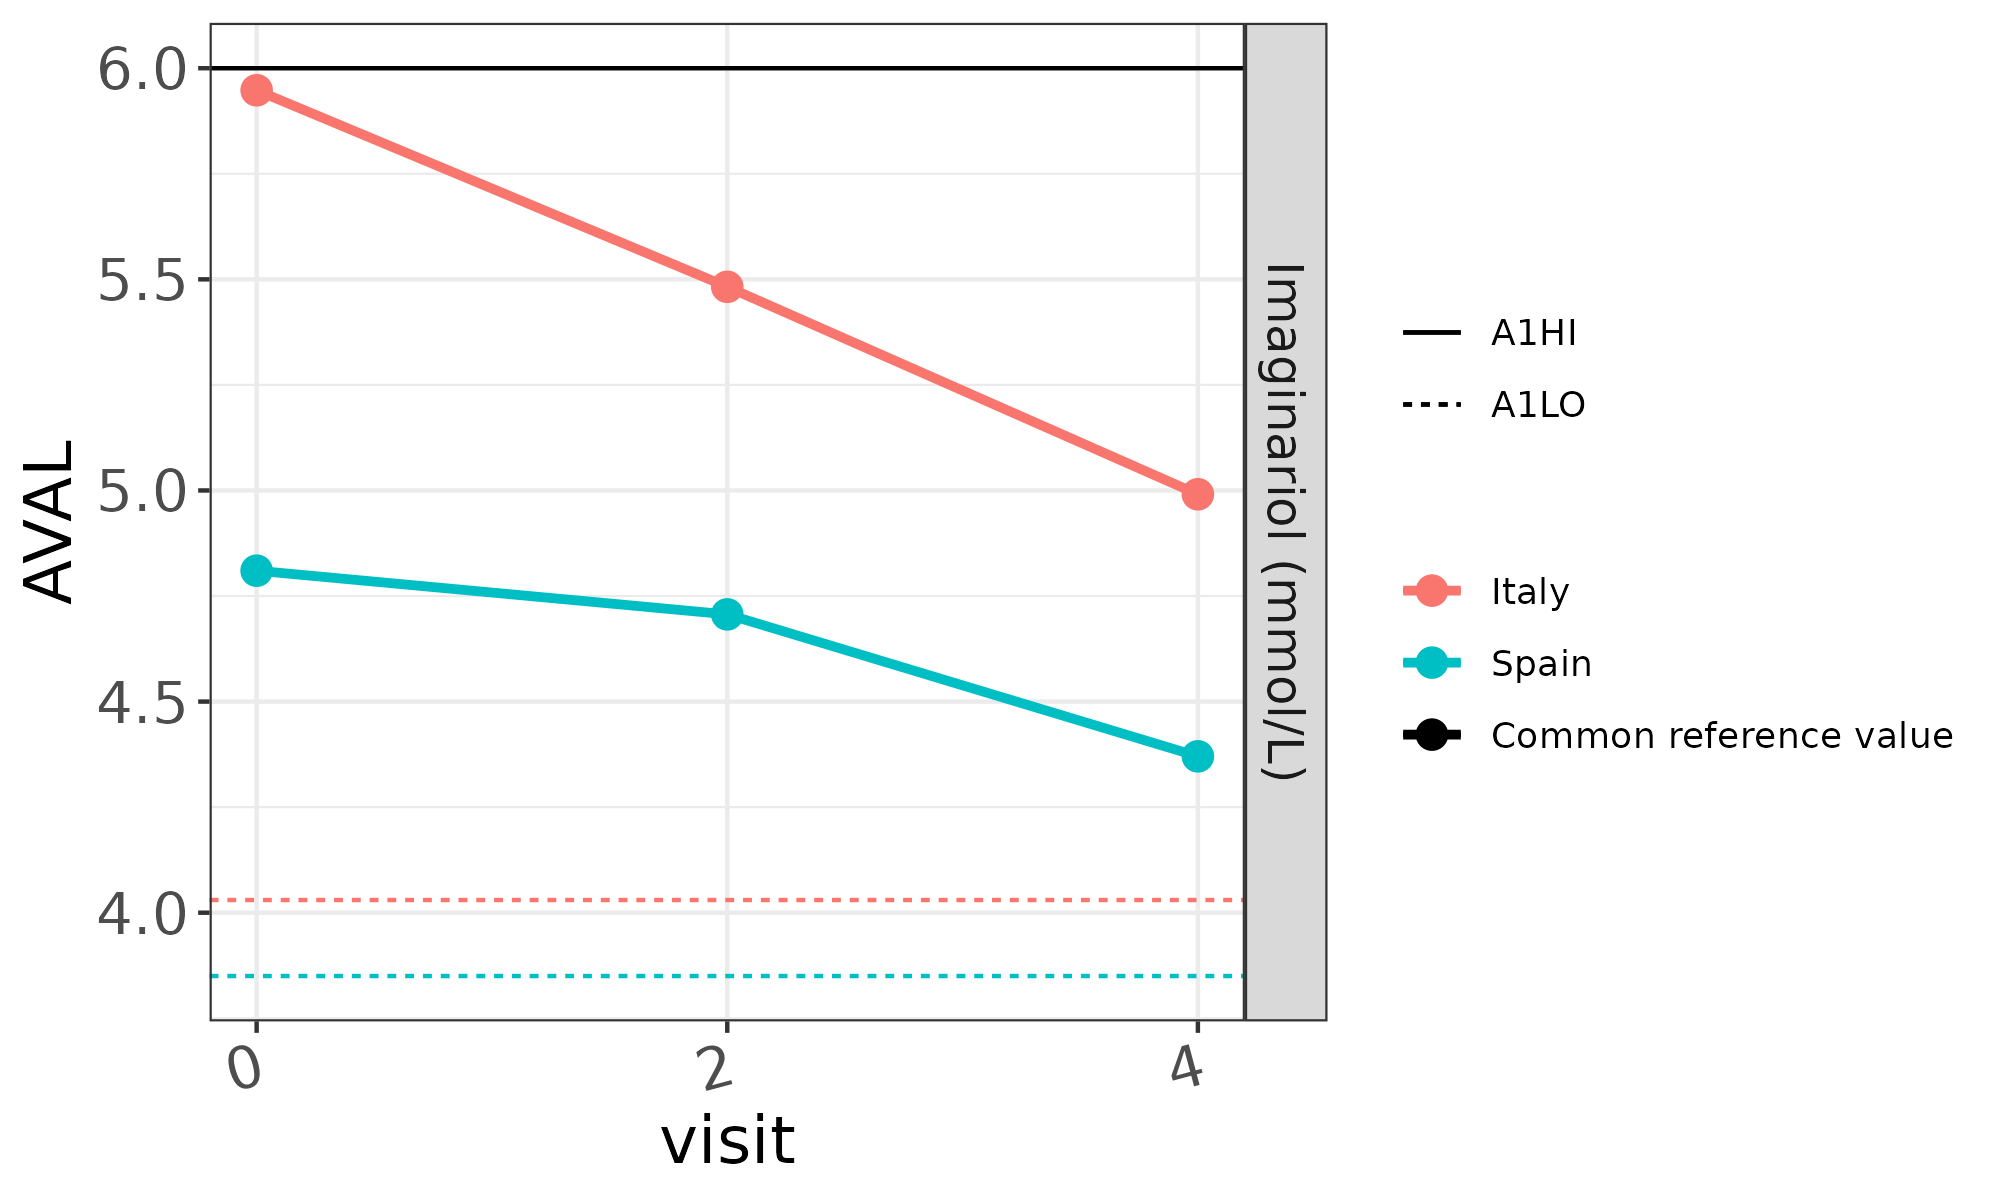
This plot is still factually correct in the sense that the color of
each AVAL line is color-matched with the A1LO
value that shares the same row in the lb dataset.
Disappearing reference lines
What happens if we don’t provide a main grouping variable?
dv.explorer.parameter::mod_lineplot(
  ..., ref_line_vars = c("A1LO", "A1HI")
)
In this case, mod_lineplot can’t use color to pair the
A1LO reference lines to the AVAL lines, so the
reference lines are omitted:
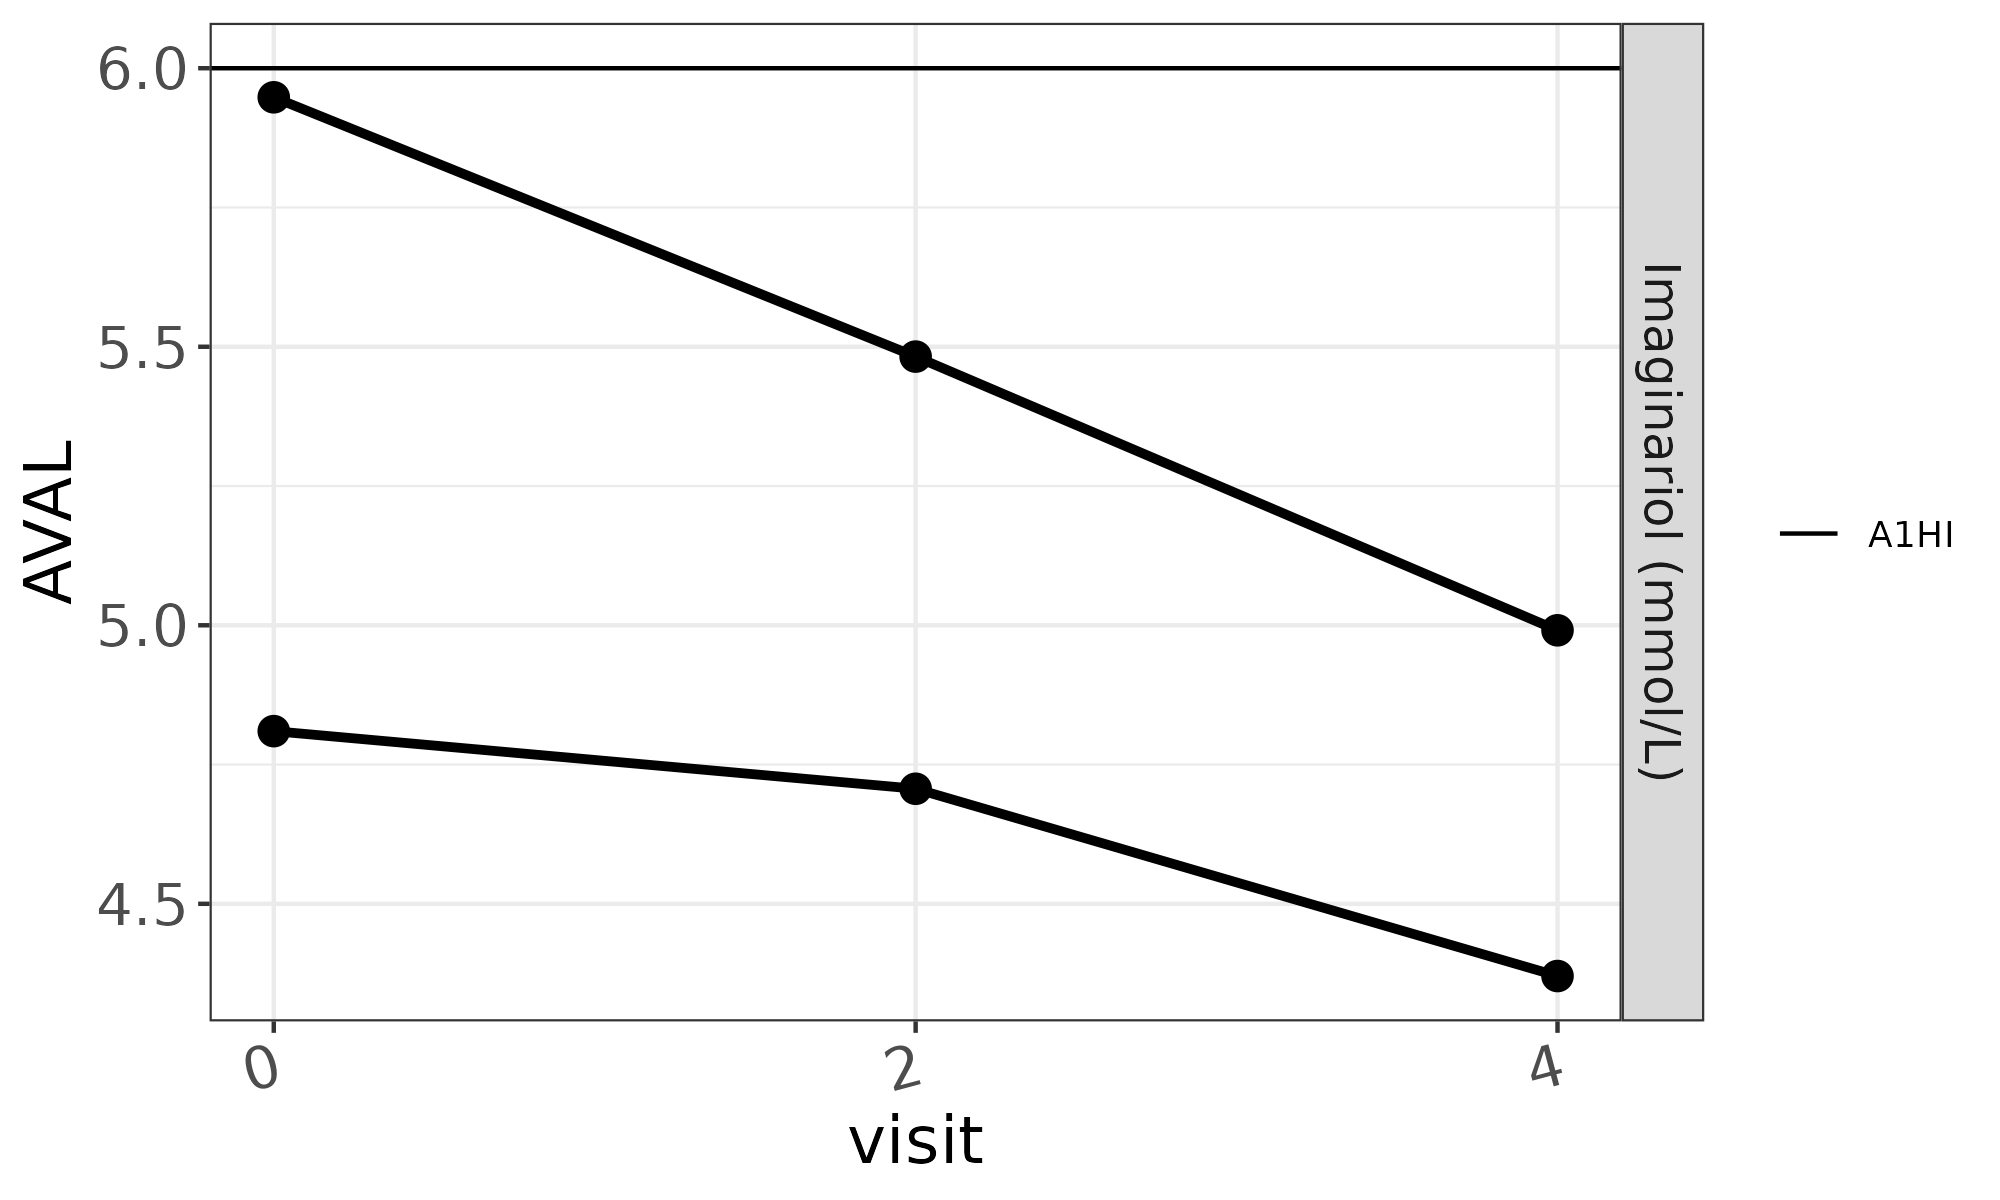
Notice, however, that the A1HI value still applies to
both black AVAL lines, so it is kept.
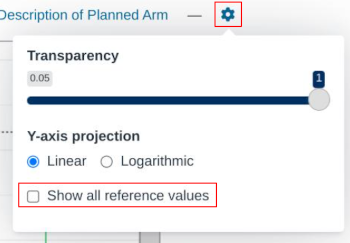
Displaying all reference values
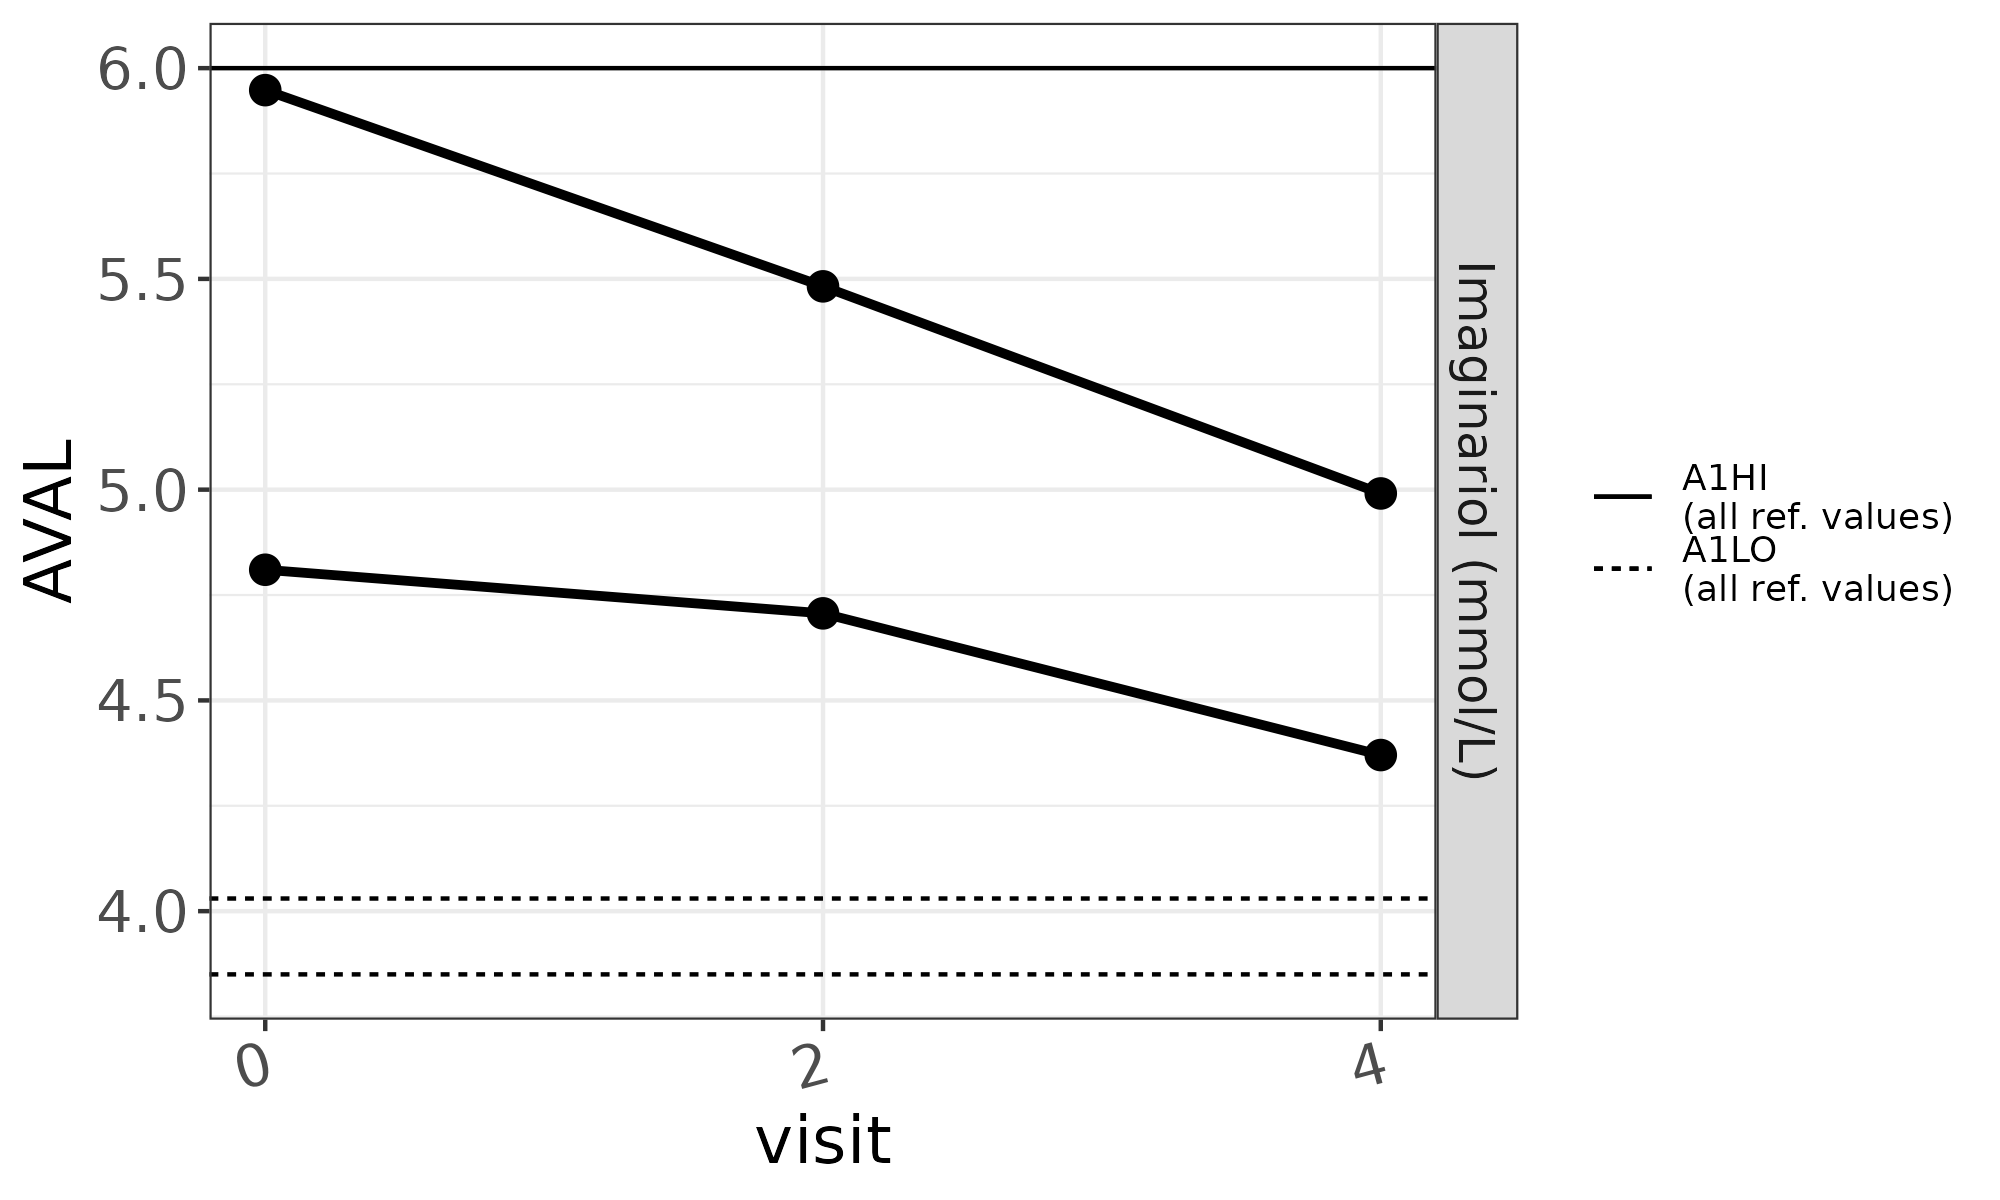
Sometimes it’s useful to see all reference values regardless of whether they can be represented truthfully under some particular data grouping. To do that, users can override the built-in reference line filter by checking the “Show all reference values” option under the “Settings” drop-down menu.
If we do that, all unique reference values are shown. The legend entries are also modified to point out the non-standard nature of the plot.
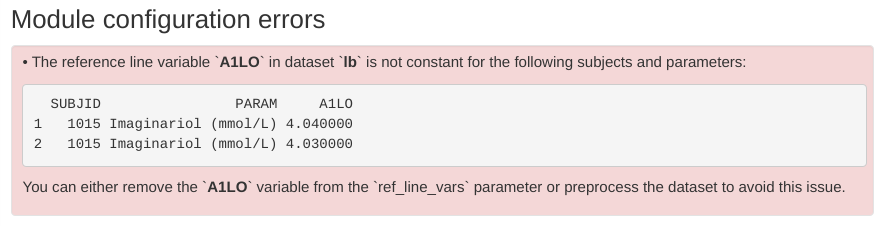
Requirements for reference values
All reference value variables assigned to ref_line_vars
should:
- be numerical
- remain constant across every combination of subject and parameter of the dataset
If one of these conditions is not met during module start-up,
mod_lineplot will produce a suitable error message, such
as: