Lineplot module
lineplot.Rmd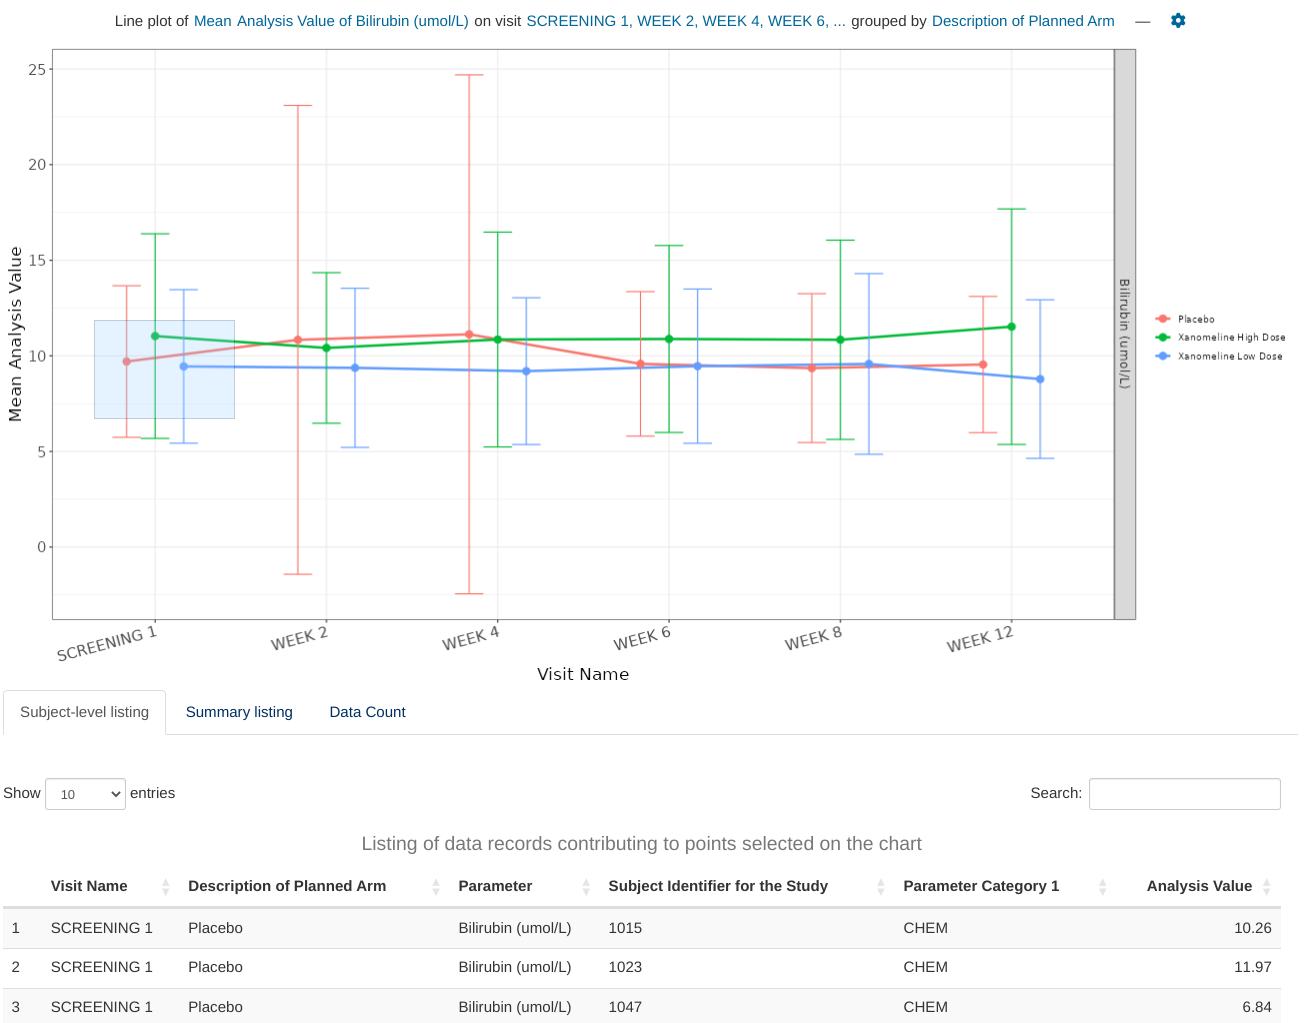
This guide provides guidance on creating Apps in DaVinci using the lineplot module. Walk-throughs for sample app creation are also included to demonstrate various module-specific features.
The lineplot module displays line traces of raw or summary data over time. It also allows to inspect the data underlying each point on the plot through its “data listing” and “data count” tables.
Pre-requisite:
 “Parameter” Term Disambiguation
The guide uses the term “parameter” at several places. This term in the guide represents clinical analysis parameters and values such as laboratory values, safety values, etc as used in the clinical dataset context. This can be confused with the word parameter as used in a programming context - “parameters of a function”. Therefore, to fully disambiguate the usage in this guide:
- Parameter is used exclusively in the clinical dataset context
- Argument is used to represent parameter of a function in the programming context
Features
lineplot features the following plot and tables:
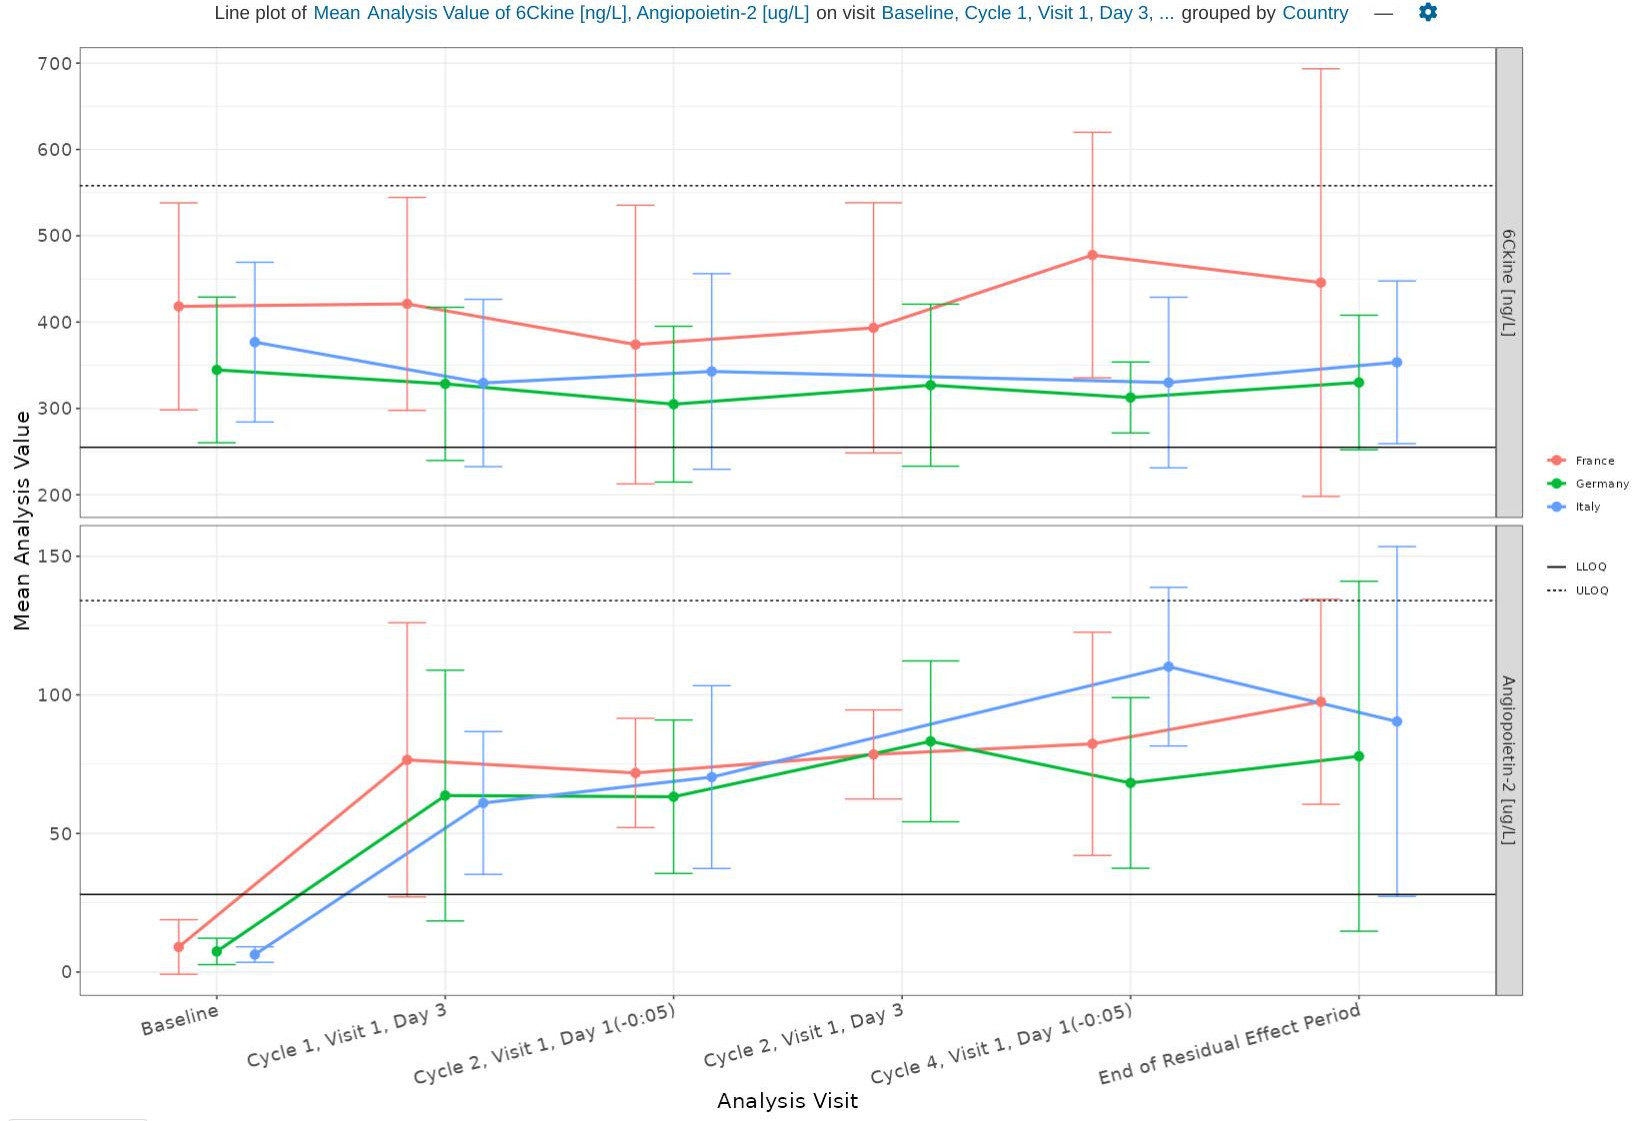
- A sequence of lineplot charts that display raw or summaries of time series, optionally grouped by up to two categorical variables. Built-in summary functions are mean and median, but this module also accepts user-supplied functions
- A table that shows the data that contributes to the last points clicked or brushed in any of those charts
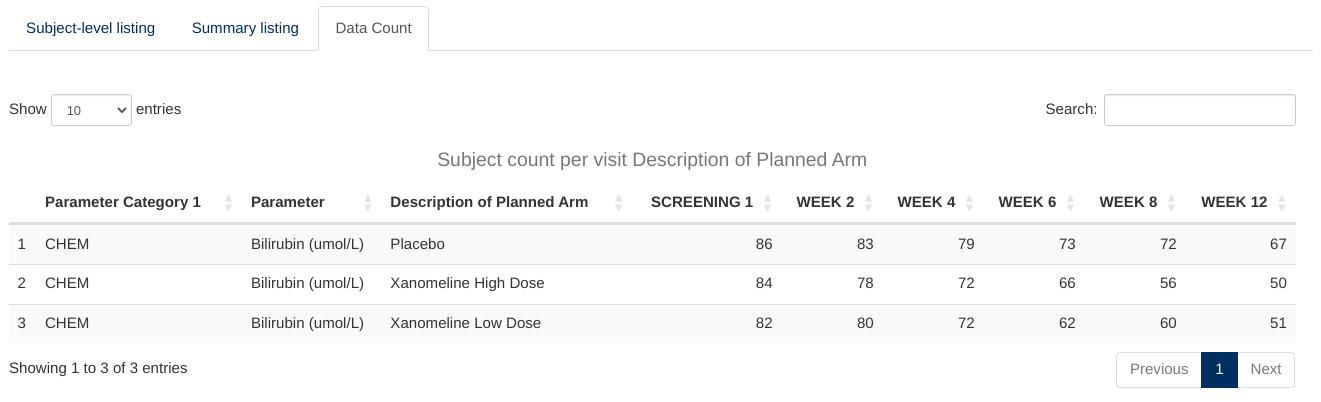
- A table that provides the count of samples per group and time point.
This module supports bookmarking.
Module arguments
The dv.explorer.parameter::mod_lineplot() module presents mandatory and optional function arguments to the app creator.
Mandatory Arguments
module_id: A unique identifier of type character for the module in the app.-
bm_dataset_name: The dataset that contains the continuous parameters. It expects a dataset similar to https://www.cdisc.org/kb/examples/adam-basic-data-structure-bds-using-paramcd-80288192 , 1 record per subject per parameter per analysis visit.It should have, at least, the columns passed in the arguments,
subjid_var,cat_var,par_var,visit_varsandvalue_vars. -
group_dataset_name:It expects a dataset with a structure similar to https://www.cdisc.org/kb/examples/adam-subject-level-analysis-adsl-dataset-80283806 , one record per subject It should have, at least, the column passed in the argument
subjid_var.
Refer to dv.explorer.parameter::mod_lineplot() for the complete list of arguments and their description.
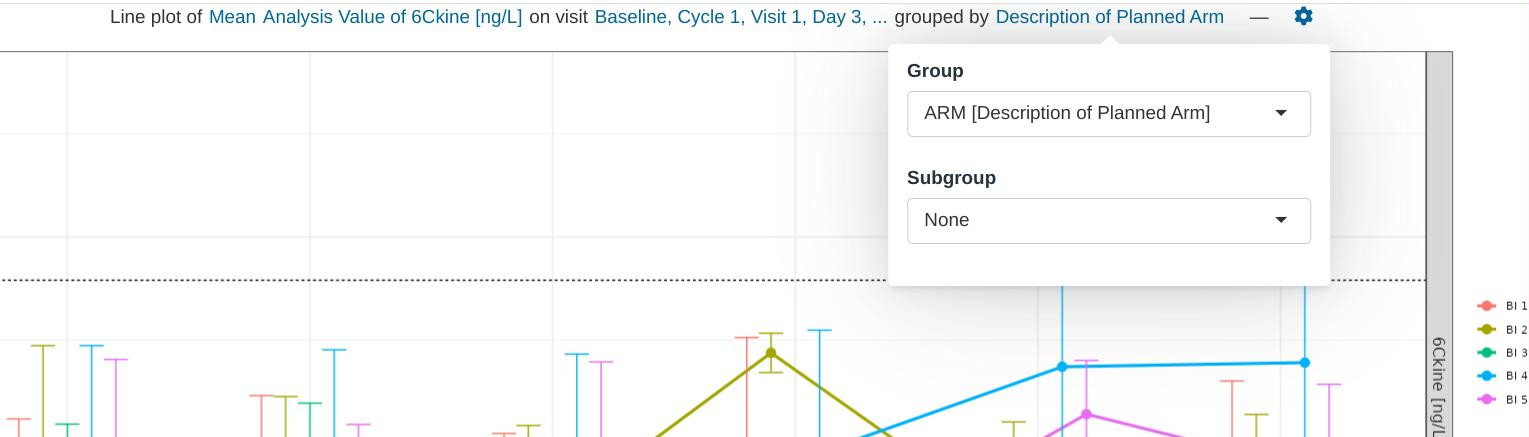
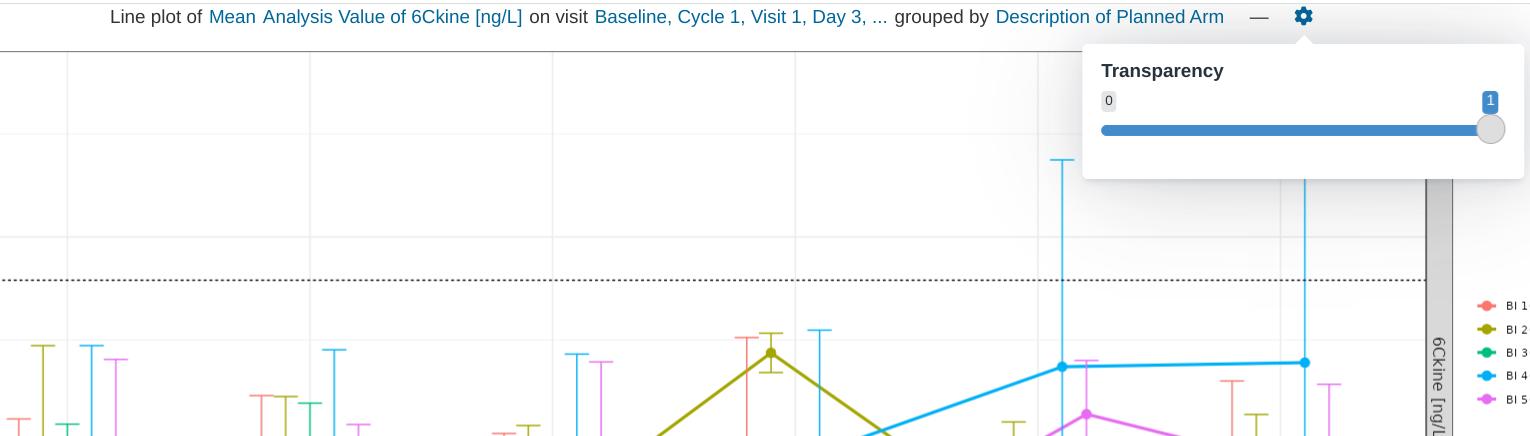
Input menus
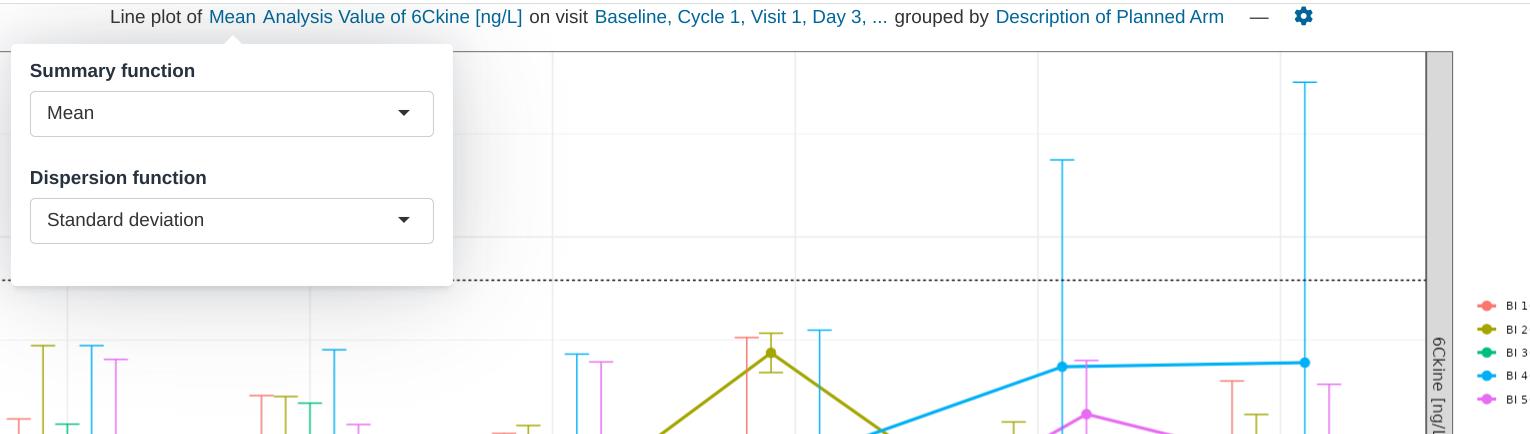
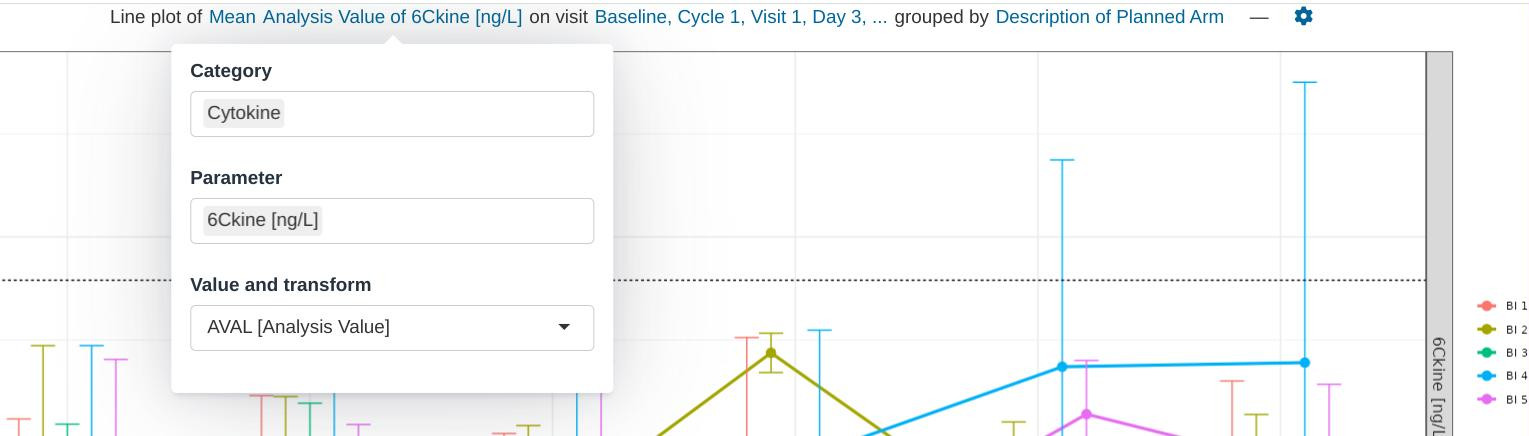
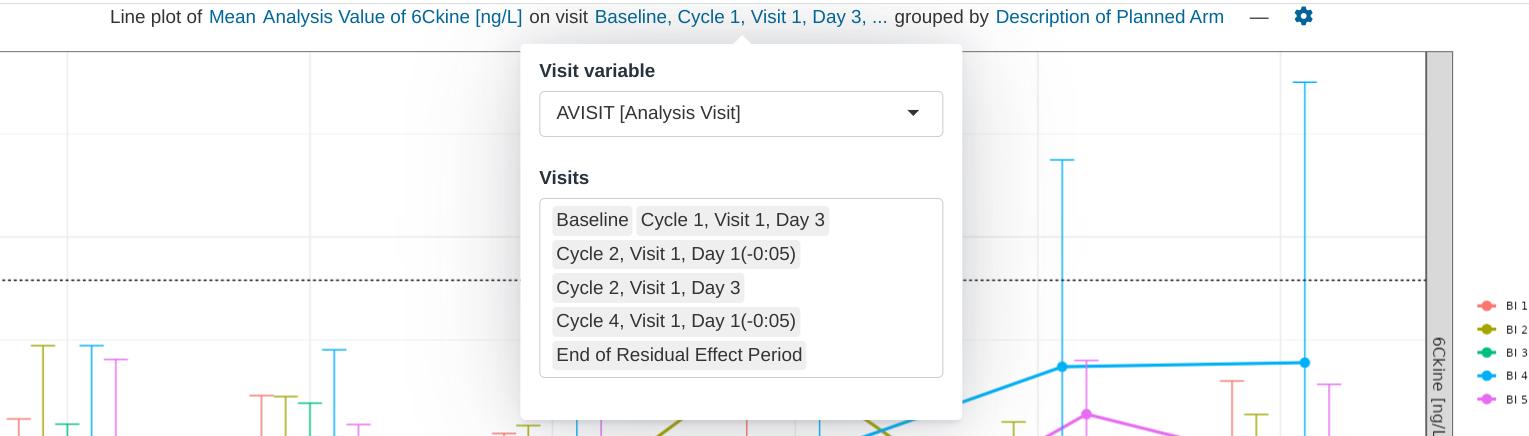
Input menus are integrated as part of the figure title. Portions of the title are stylized as hyperlinks and reveal the relevant pop-up menus when clicked.
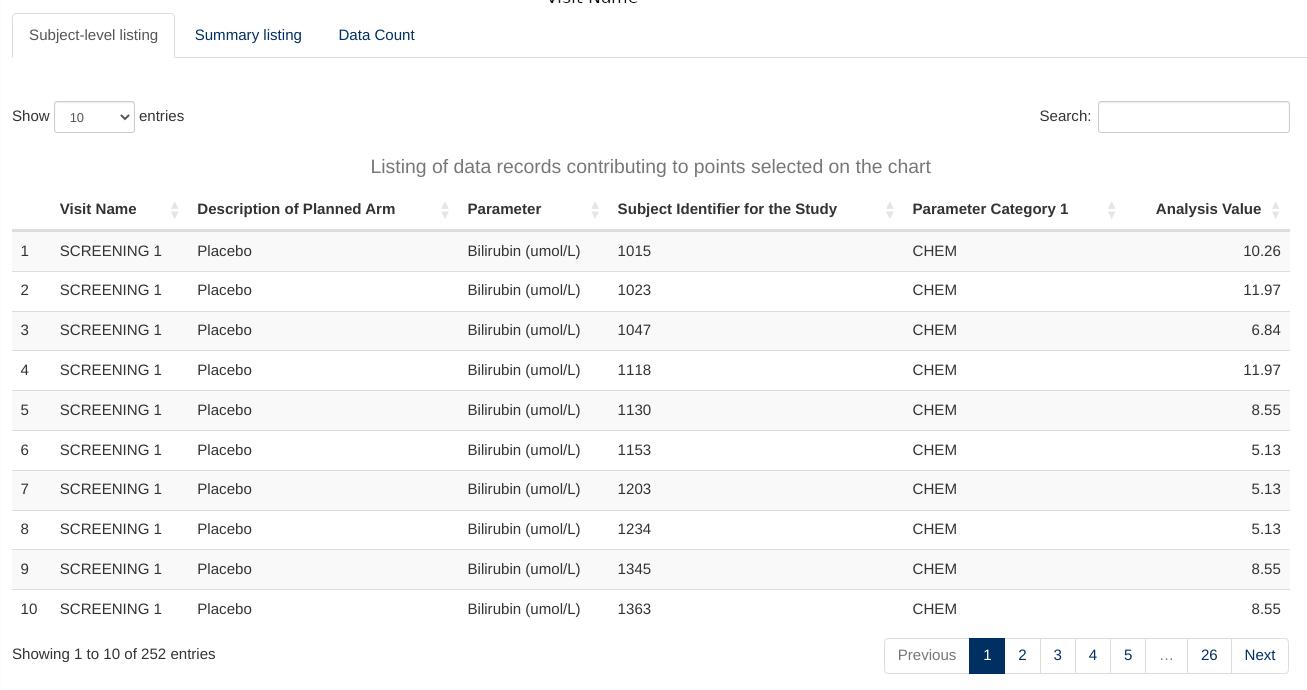
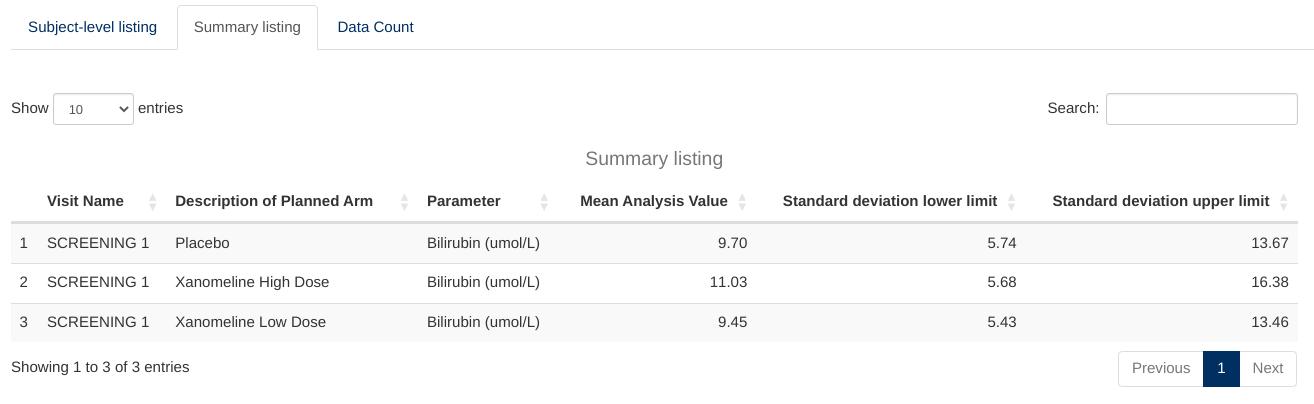
Tables
Subject-level listing
A table containing the listing of the raw data contributing to the last clicked point or brushed set of points on a lineplot.
The single subject table contains a drill-down button that can be used to obtain more information about the subject. This setting requires additional configuration through the receiver_id optional module argument.
Creating a lineplot application
module_list <- list(
  "lineplot" = dv.explorer.parameter::mod_lineplot(
    module_id = "lineplot",
    bm_dataset_name = "bm",
    group_dataset_name = "sl",
    visit_vars = "VISIT",
    value_vars = c("VALUE1", "VALUE2"),
    subjid_var = "SUBJID",
    cat_var = "PARCAT"
  )
)

bm_dataset <- test_data()[["bm"]]
group_dataset <- test_data()[["sl"]]

dv.manager::run_app(
  data = list("DS" = list(bm = bm_dataset, sl = group_dataset)),
  module_list = module_list,
  filter_data = "sl",
  filter_key = "SUBJID"
)