Module Gallery
General DaVinci packages
Module Manager by {dv.manager}
The Module Manager is the heart of each DaVinci app. It is designed to act as container for the DaVinci modules and provide the necessary infrastructure for their operation. Additionally, {dv.manager} equips the resulting DaVinci app with various functionalities, like displaying the meta information of the data, jumping between modules, switching between different trials, showing a custom start-up message, and managing global filtering across modules, so that users can define filters once and have them applied consistently to all visualizations in the app.
Data loader by {dv.loader}
Besides the Module Manager, DaVinci provides another handy utility package called {dv.loader}. It facilitates data loading from either a local or remote source, such as a network file storage folder. Once the requested data is loaded, it can be passed through customized preprocessing routines and transferred to the Module Manager for display in the DaVinci app.
DaVinci modules
Bookmark manager by {dv.bookman}
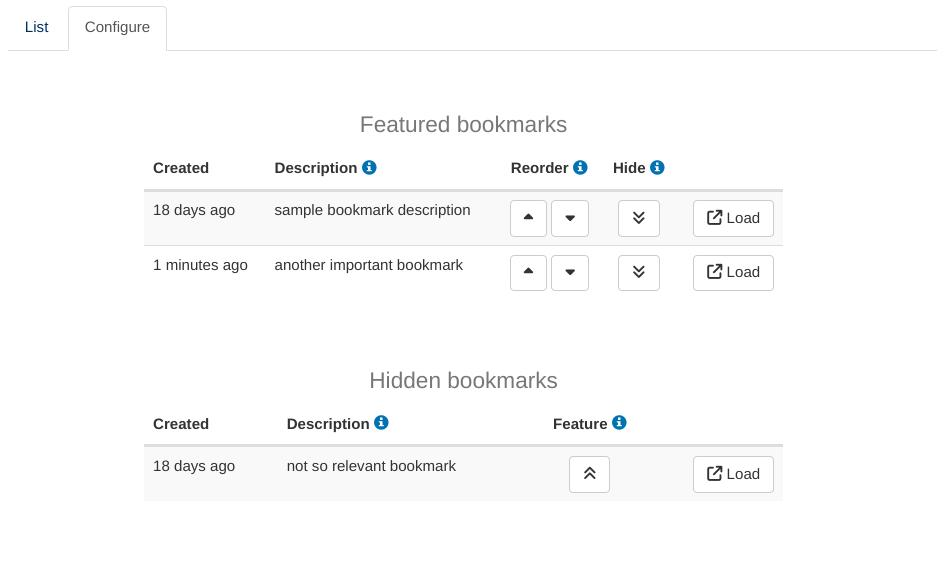
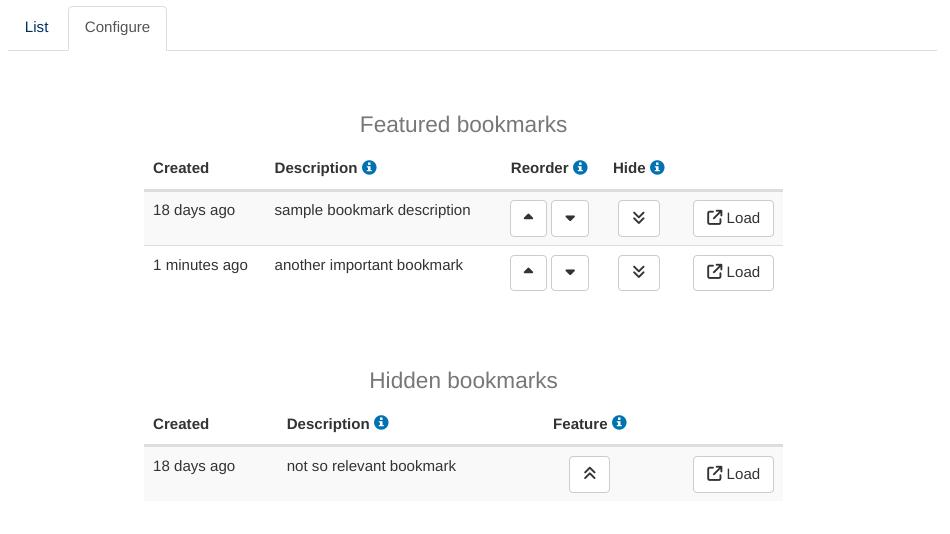
This module lists all server-side bookmarks of a shiny application, allows to describe them and feature the most relevant ones.
Use case: Any
Boxplot by {dv.explorer.parameter}
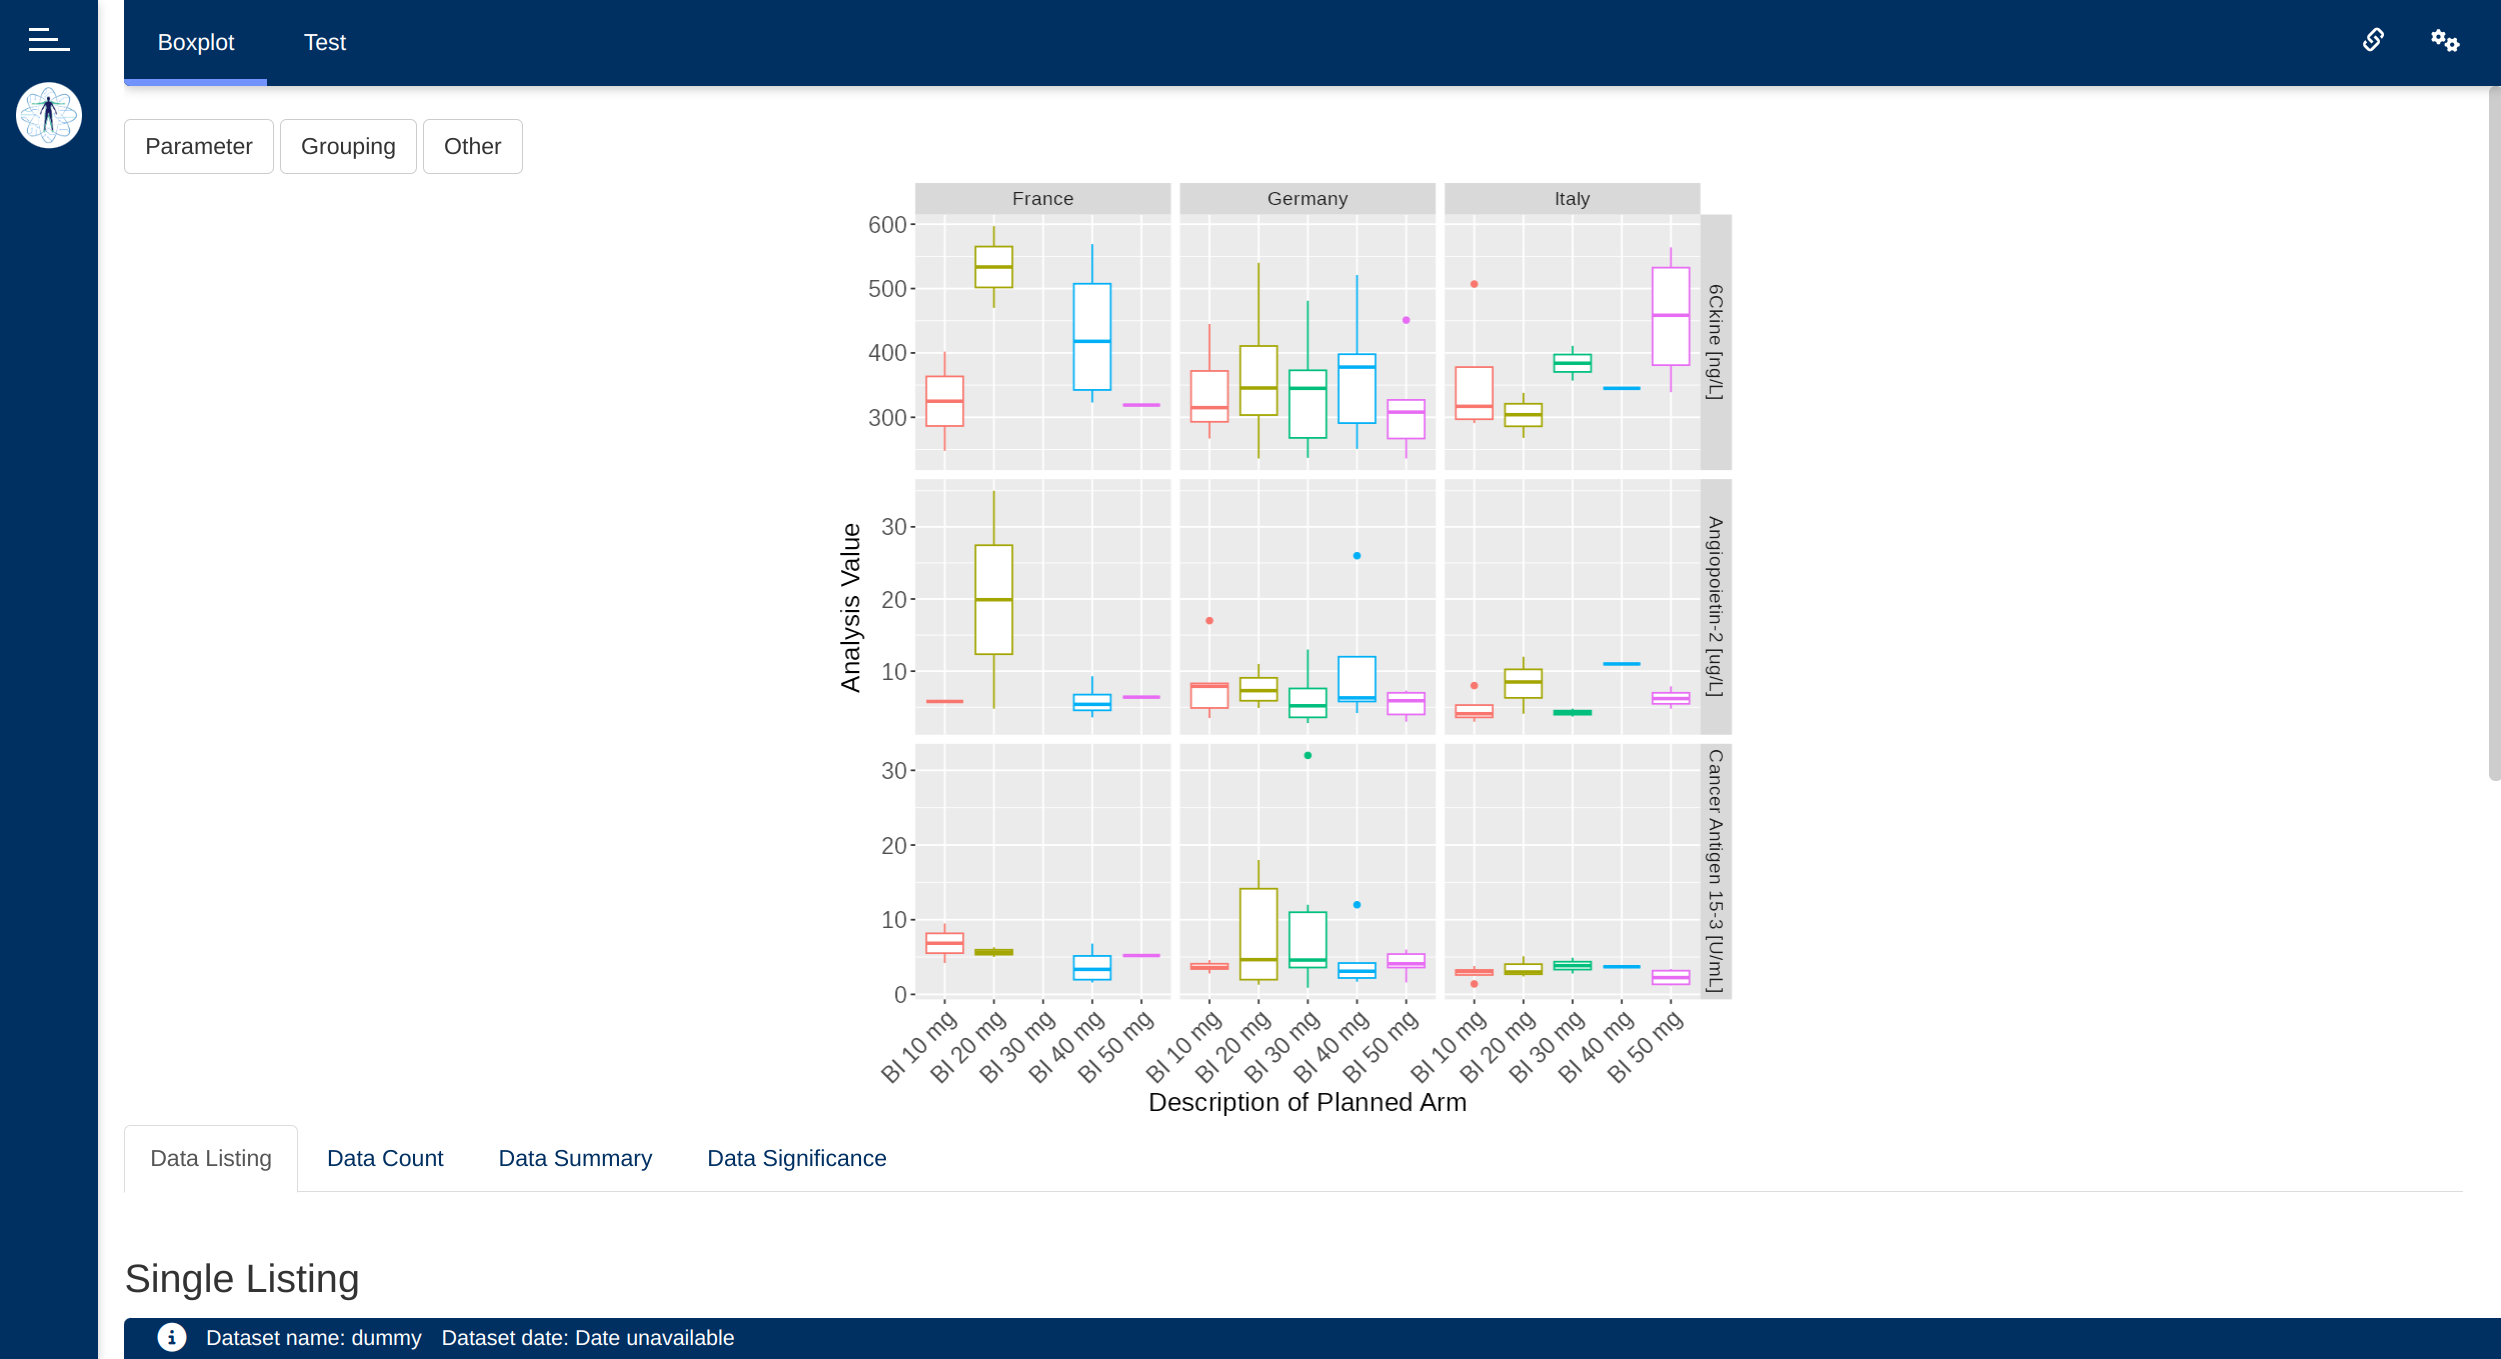
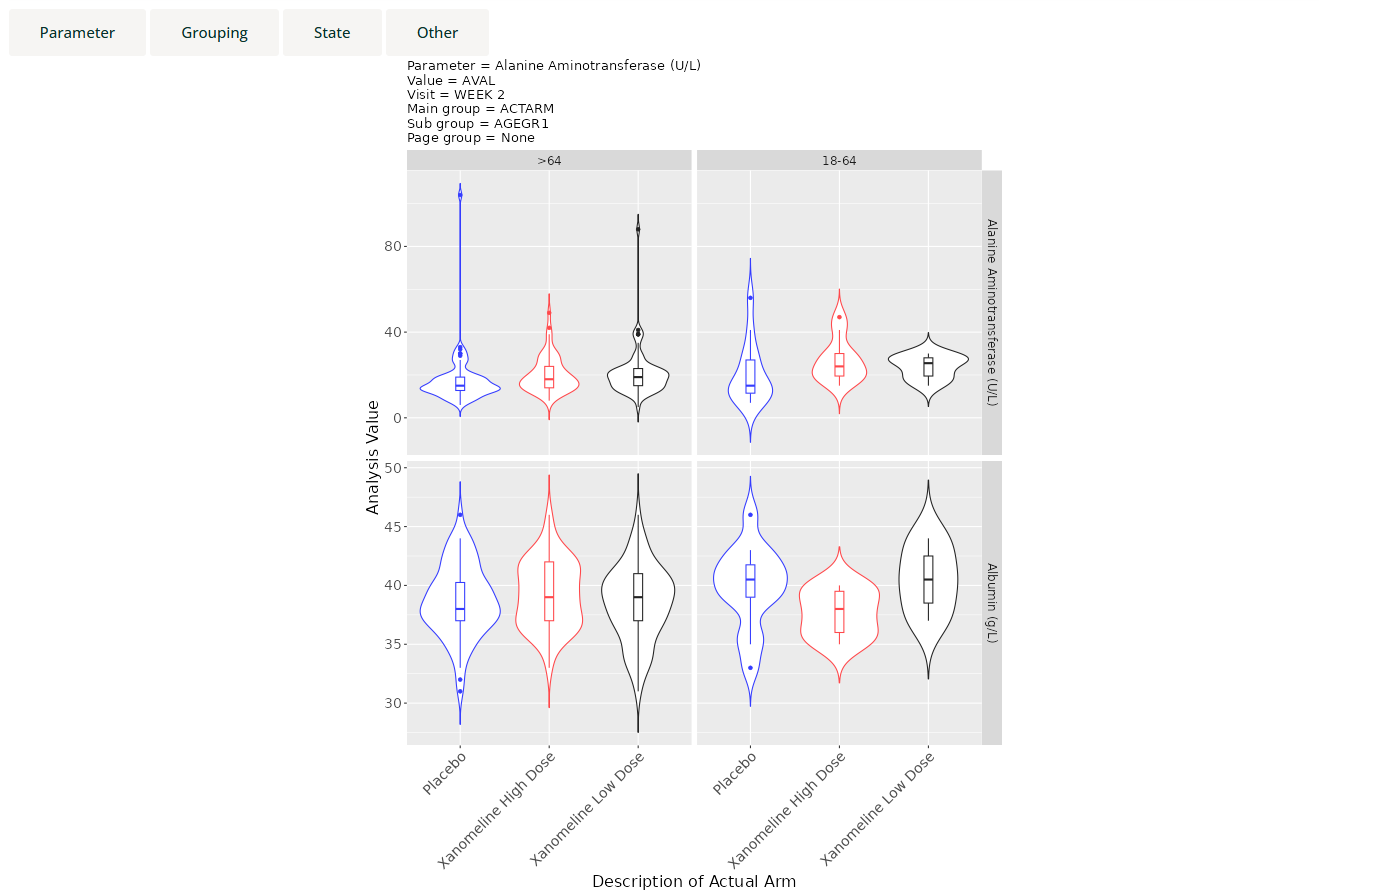
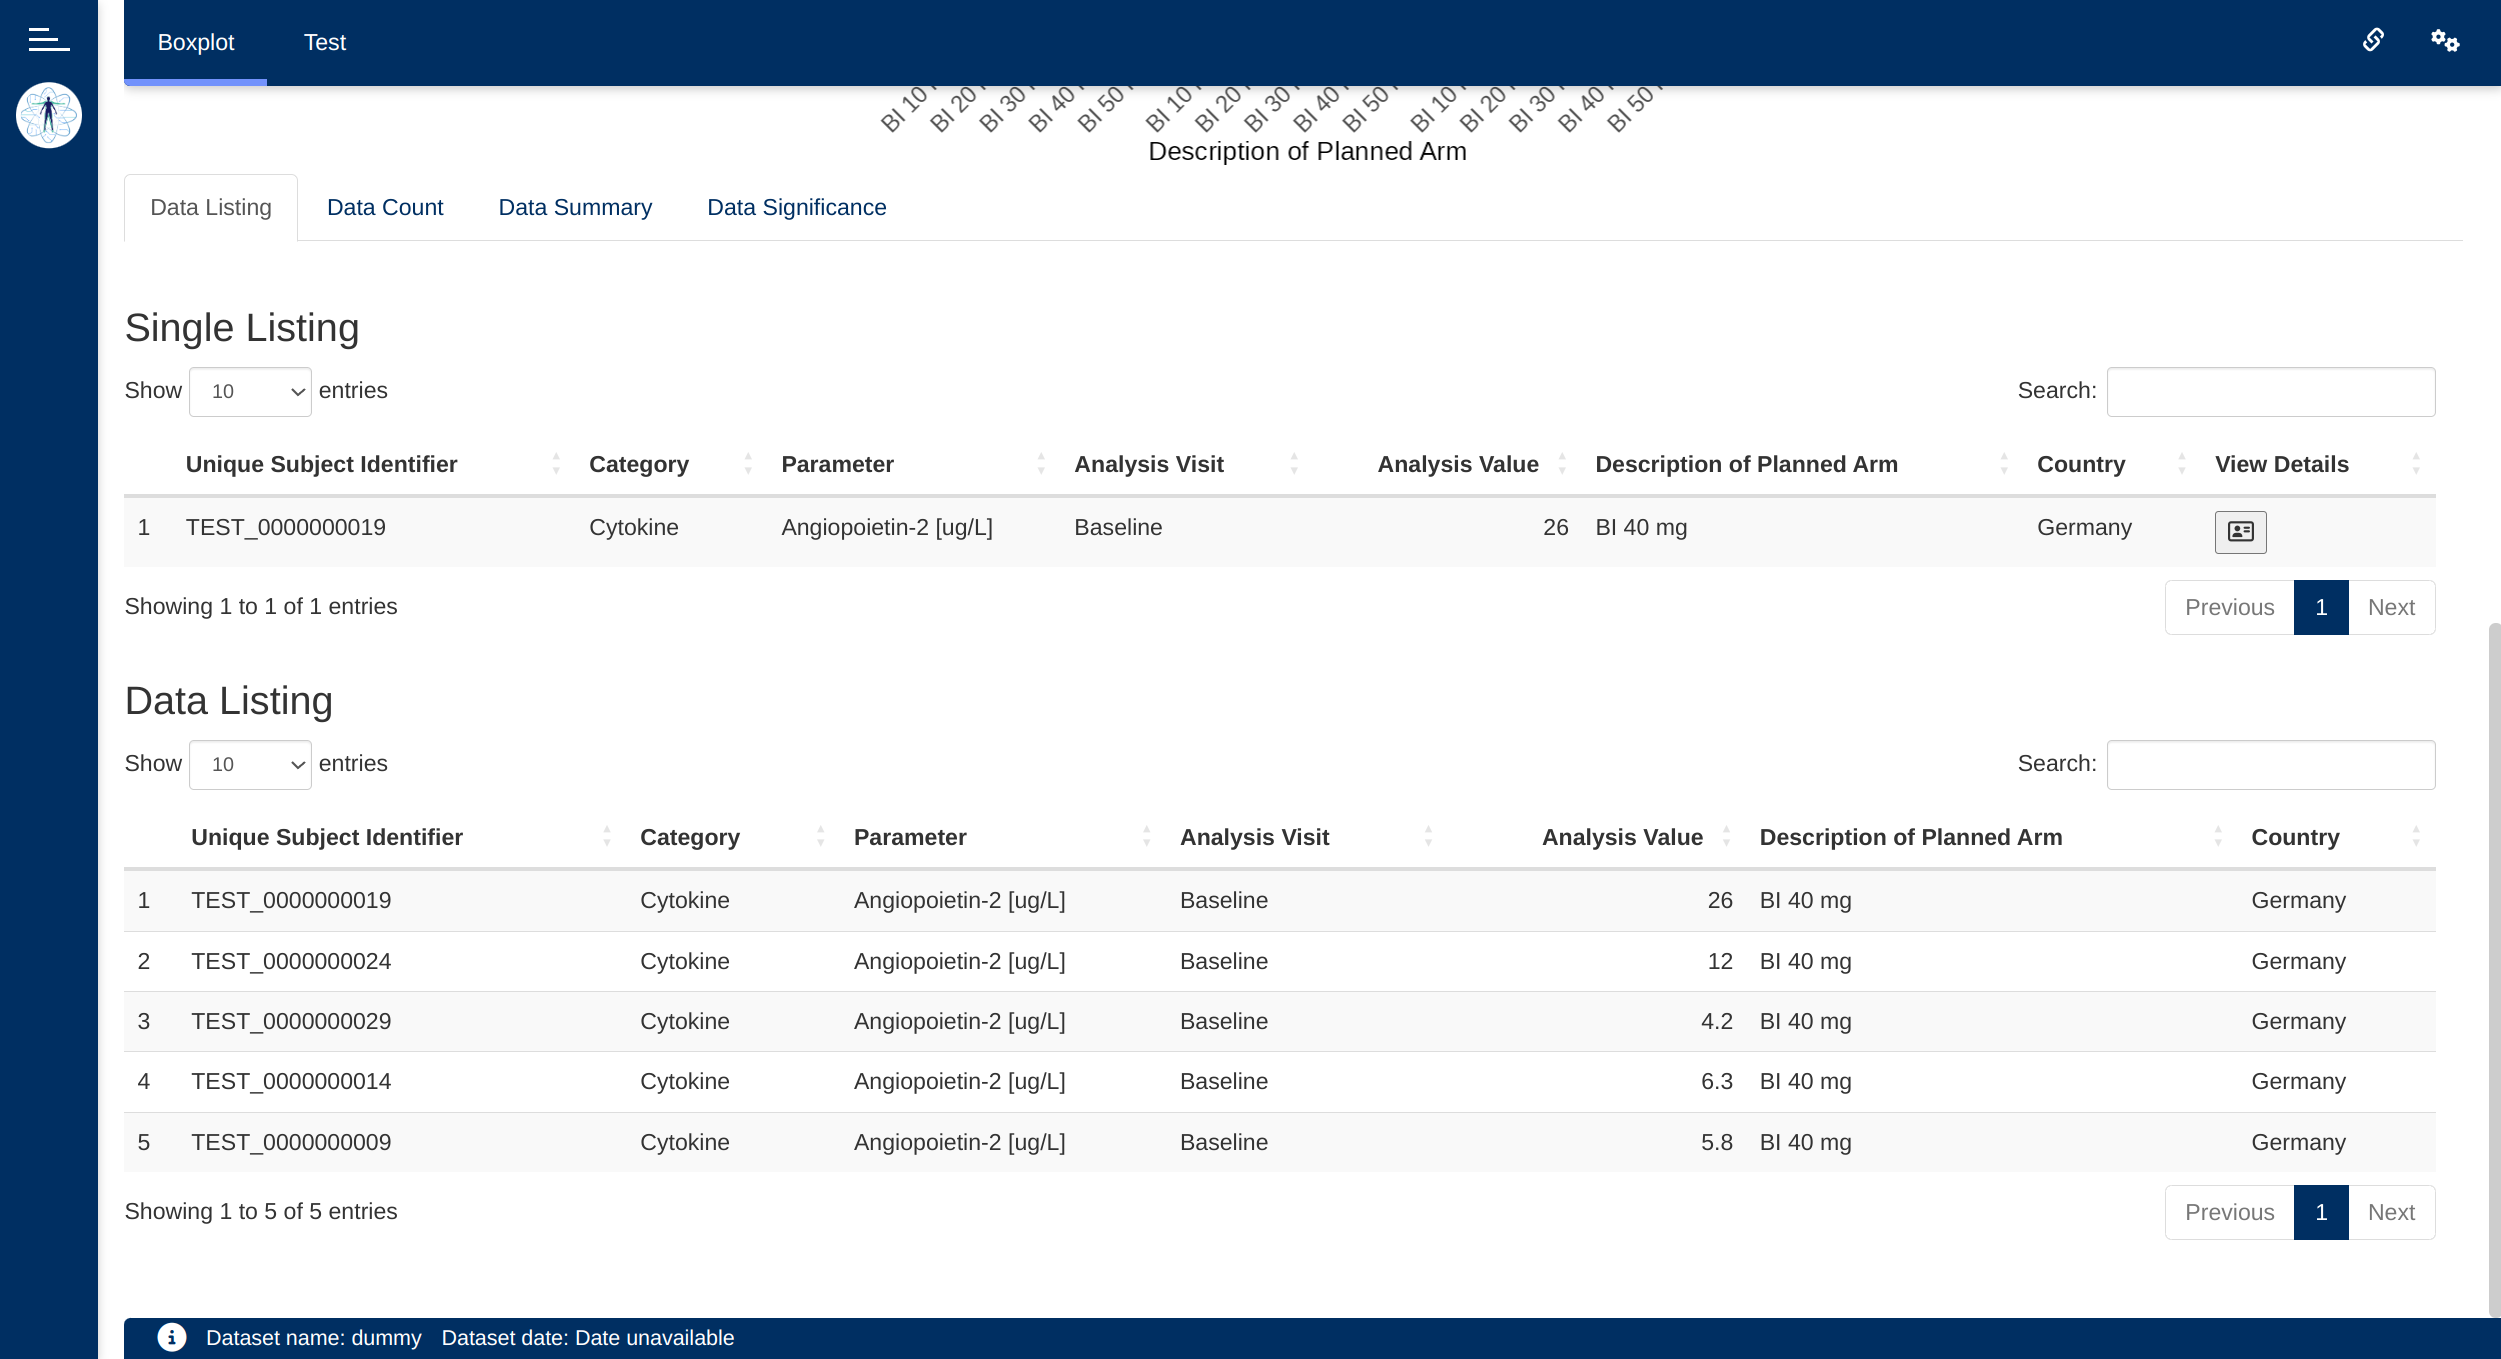
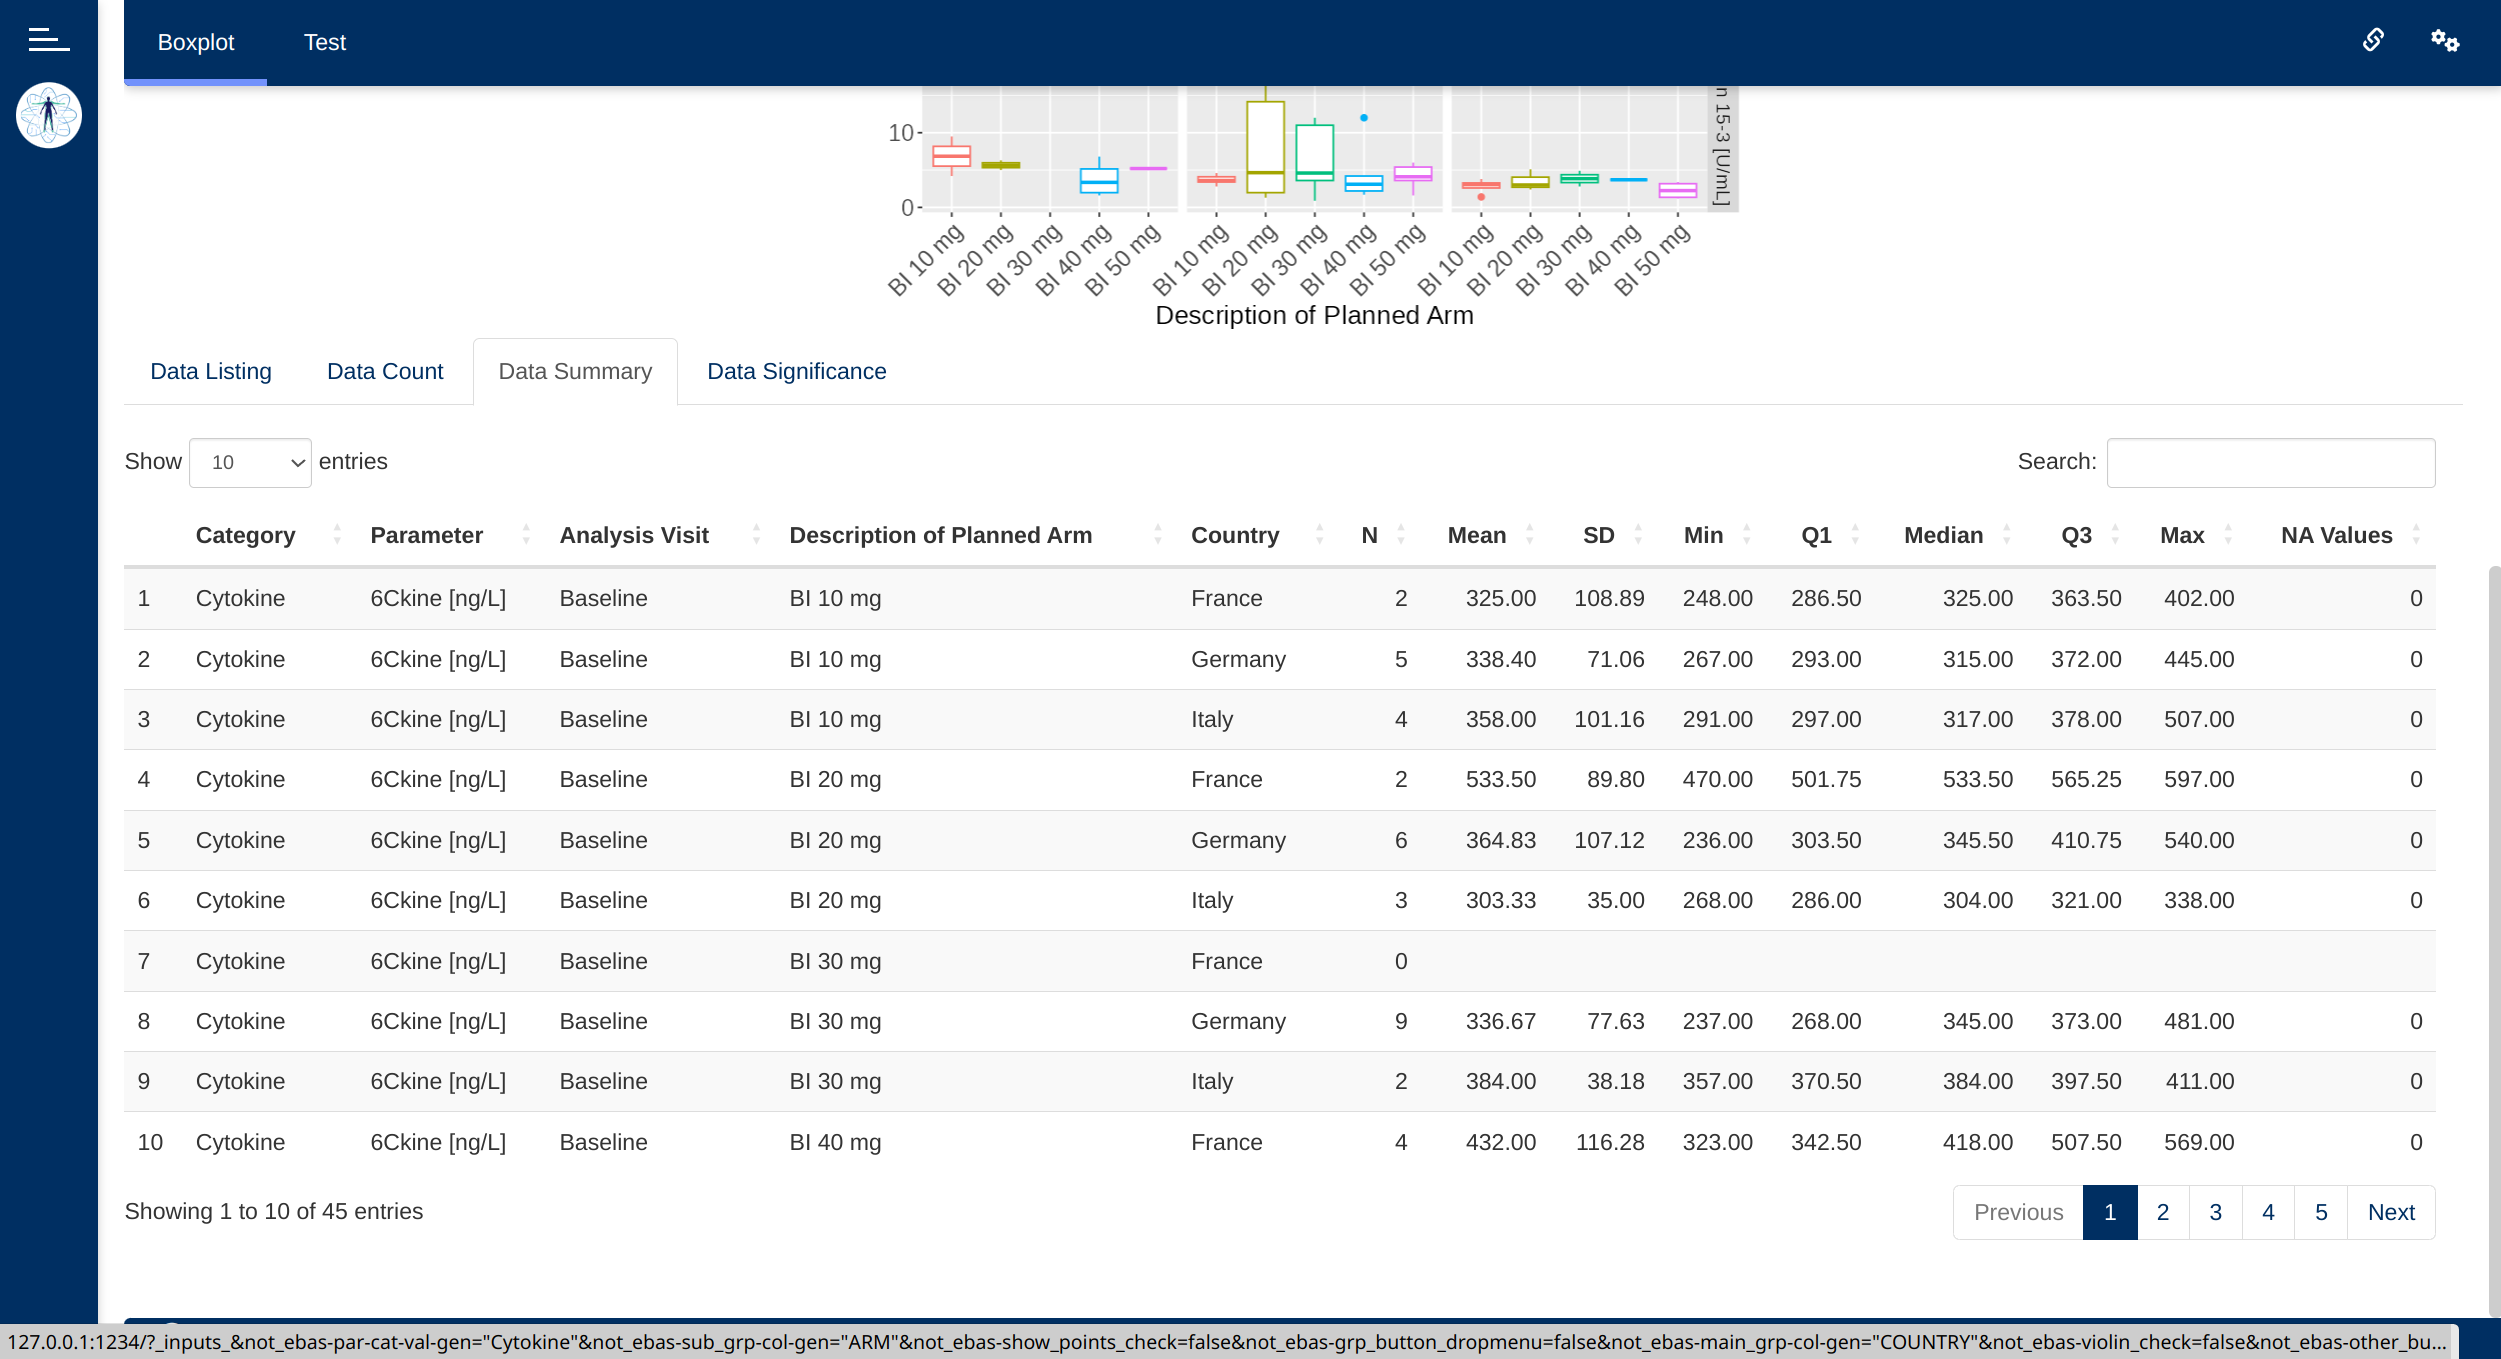
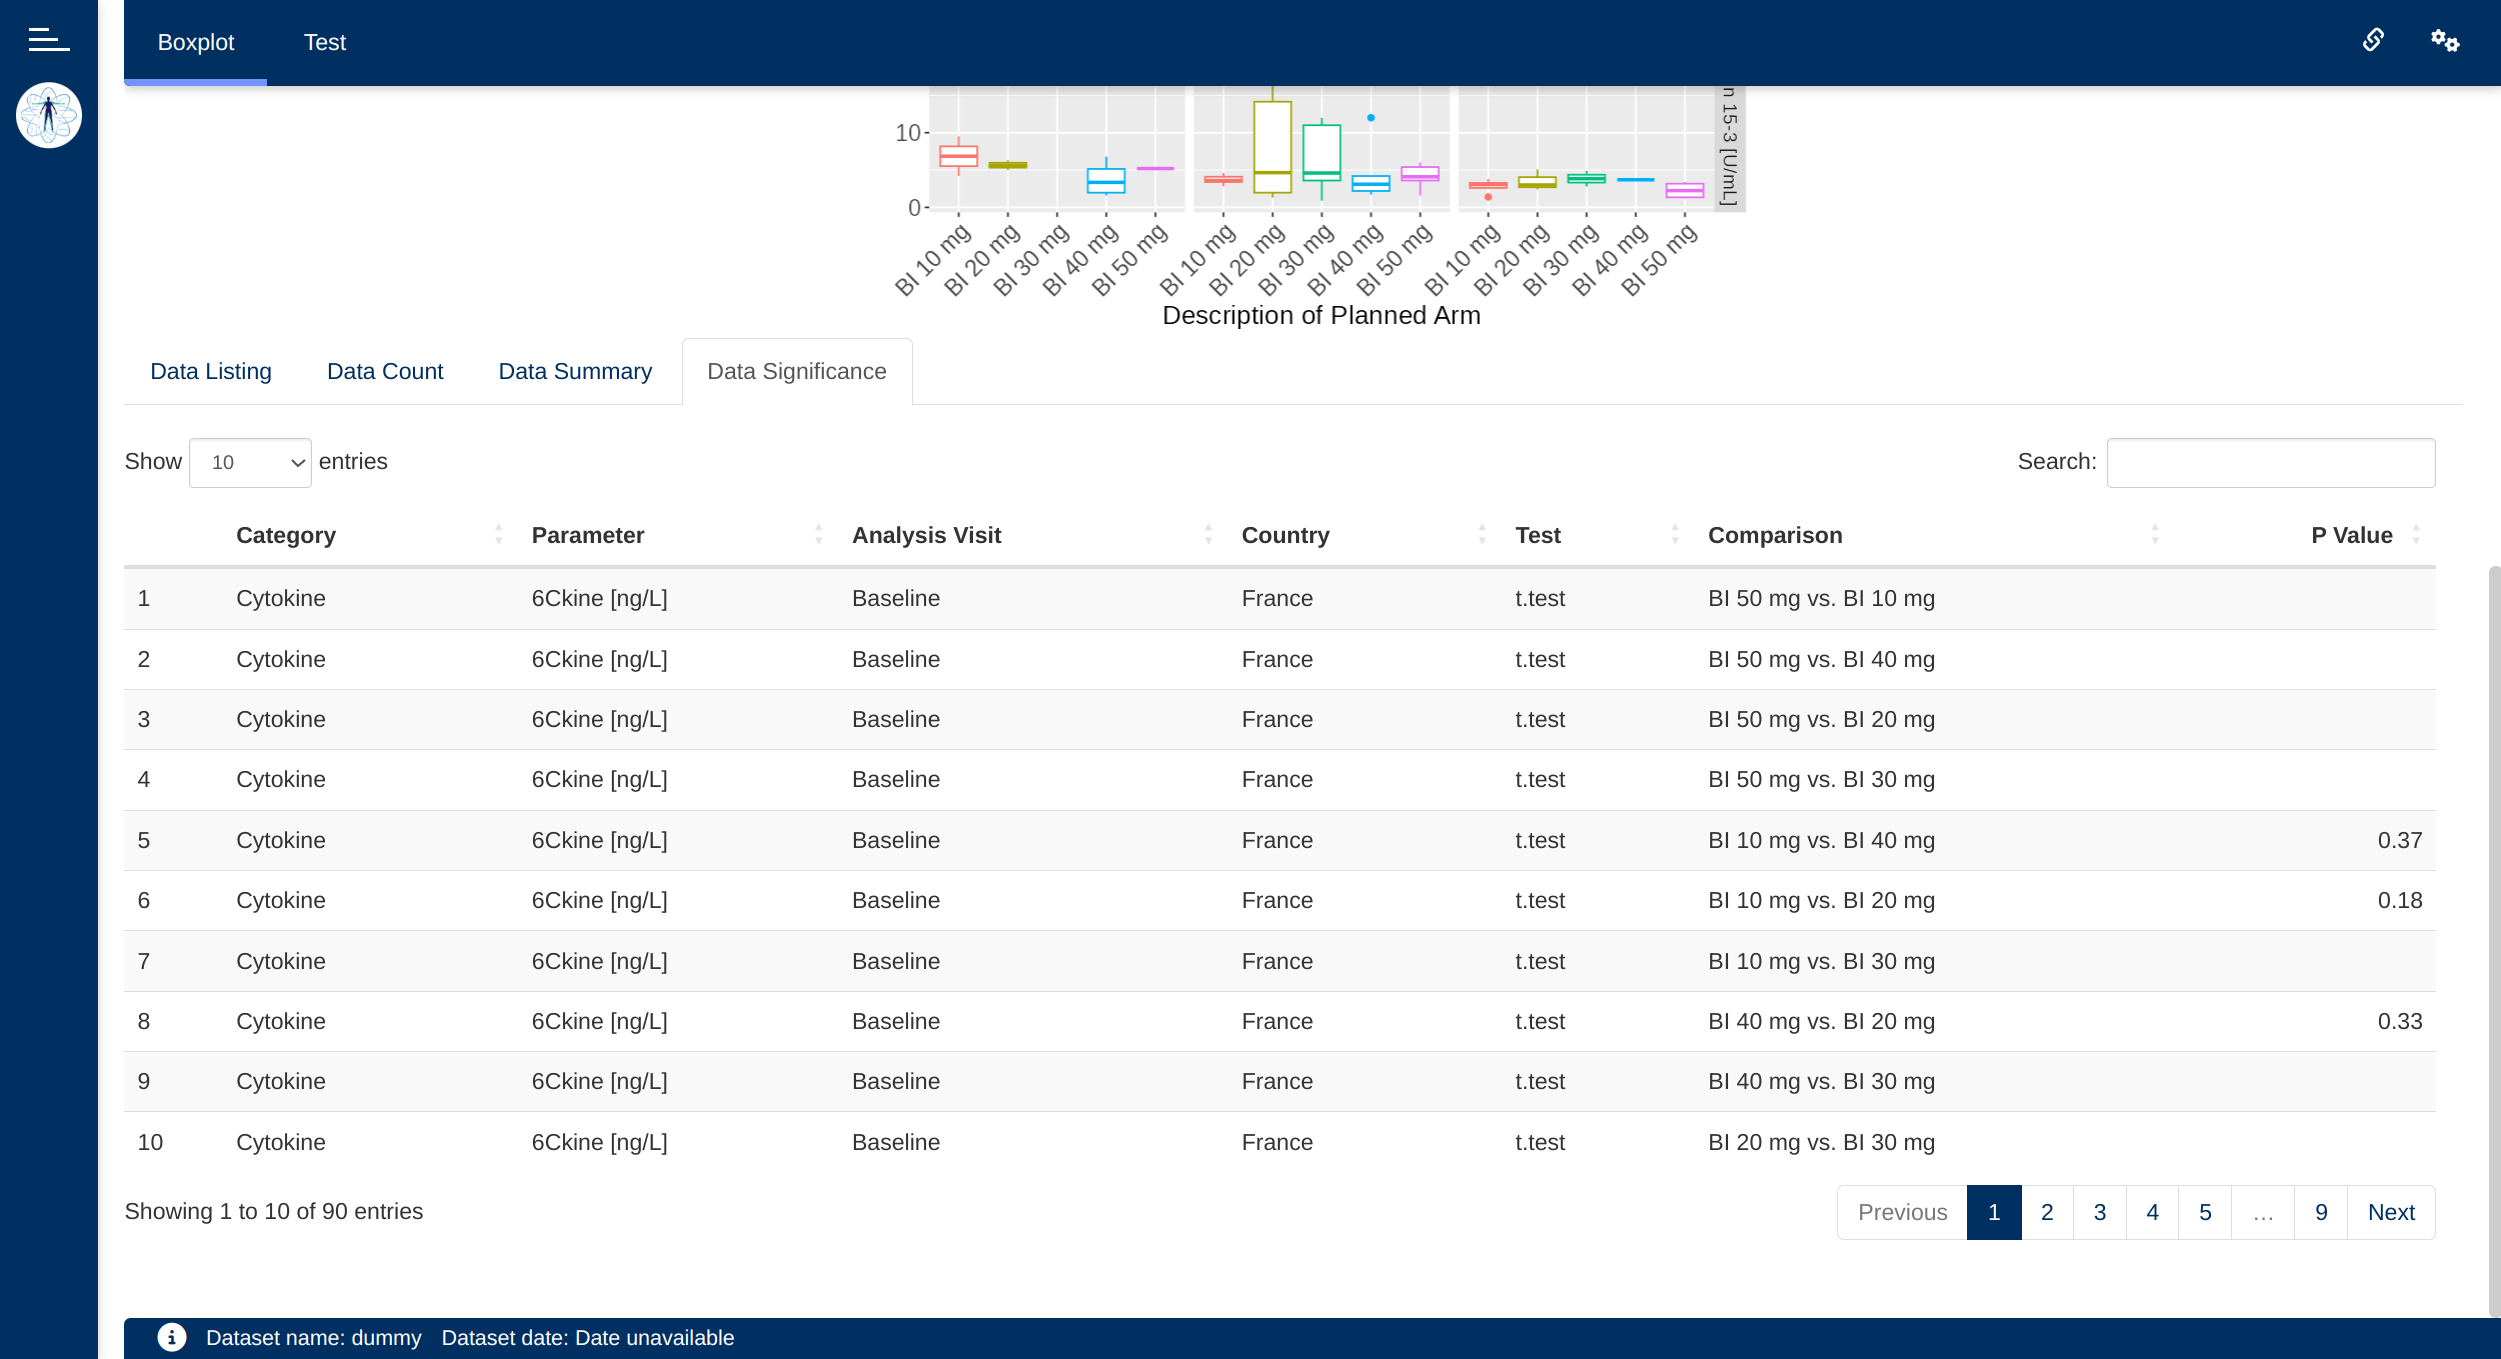
The boxplot module allows visualizing parameter data from ADaM basic data structure as boxplots and violin plots. Data can be displayed with different levels of grouping, with listings of single-subject data. It supports drill-through to Patient Profile, allowing users to click a data point and open the corresponding subject in dv.papo. It also includes statistical testing to compare the distribution of different groups.
Use case: Biomarker Analysis, Parameter Exploration
Clinical timelines by {dv.clinlines}
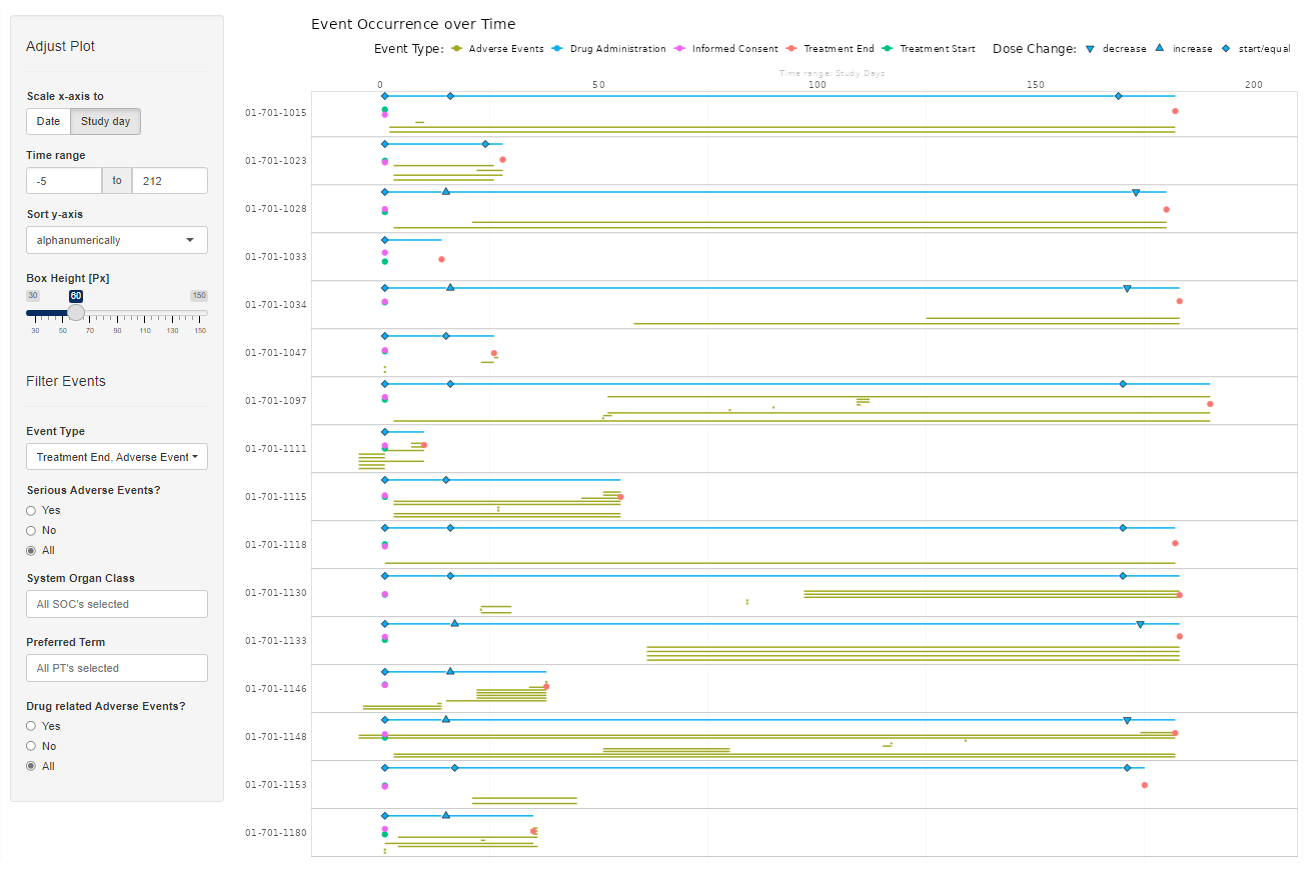
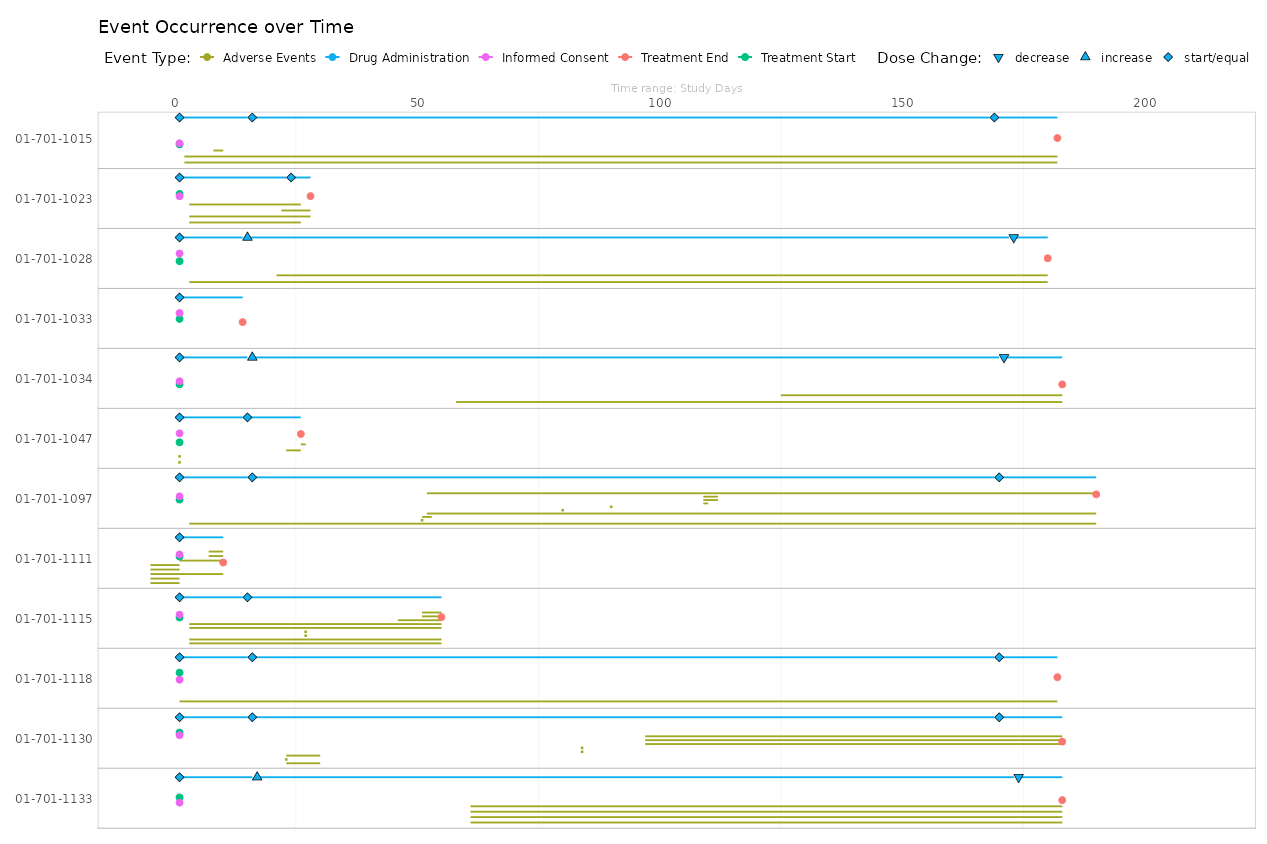
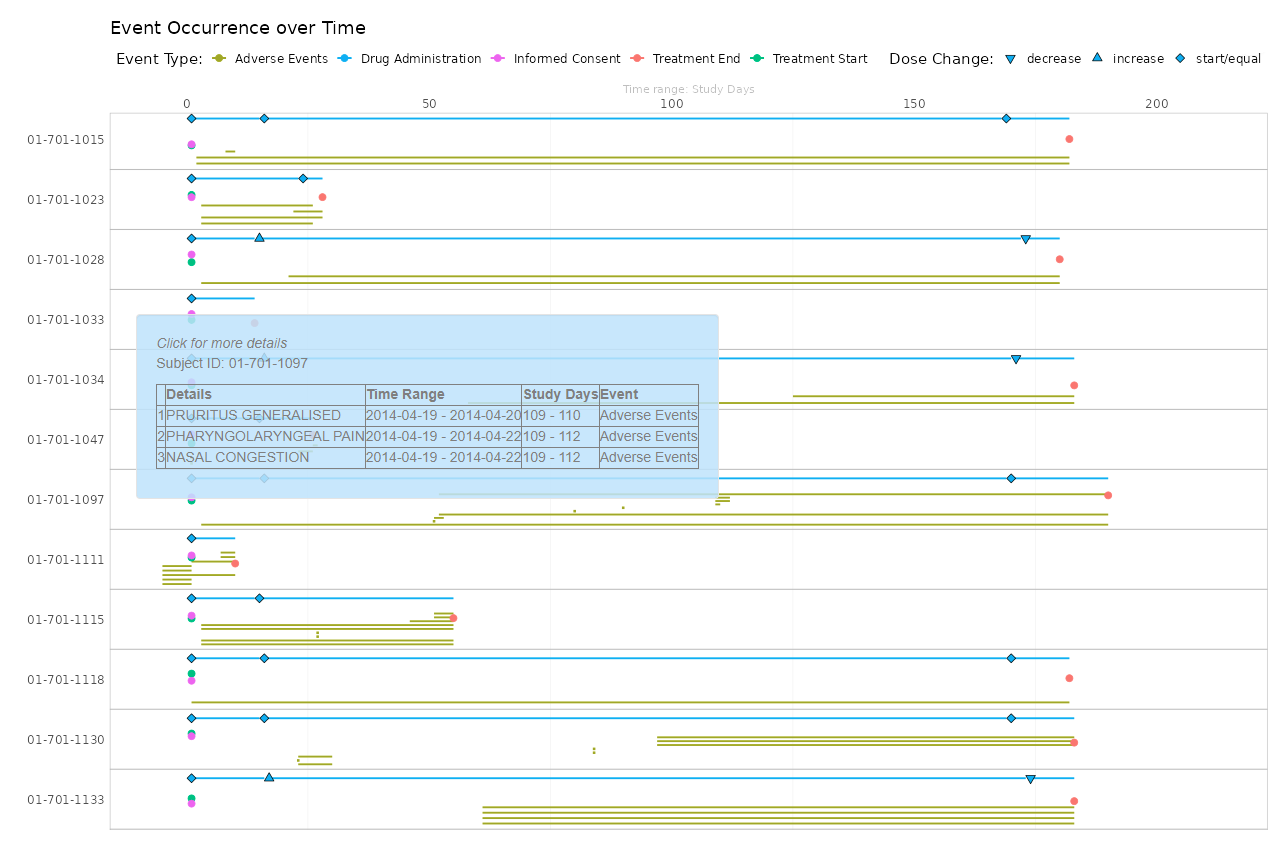
The Clinical Timelines module displays subject level data over time to present dates and/or time intervals of trial events, like adverse events, concomitant medications, randomization dates, and more. It supports drill-through to Patient Profile, allowing users to click a data point and open the corresponding subject in dv.papo.
Use case: Quality Monitoring, Safety Review
Correlation heatmap by {dv.explorer.parameter}
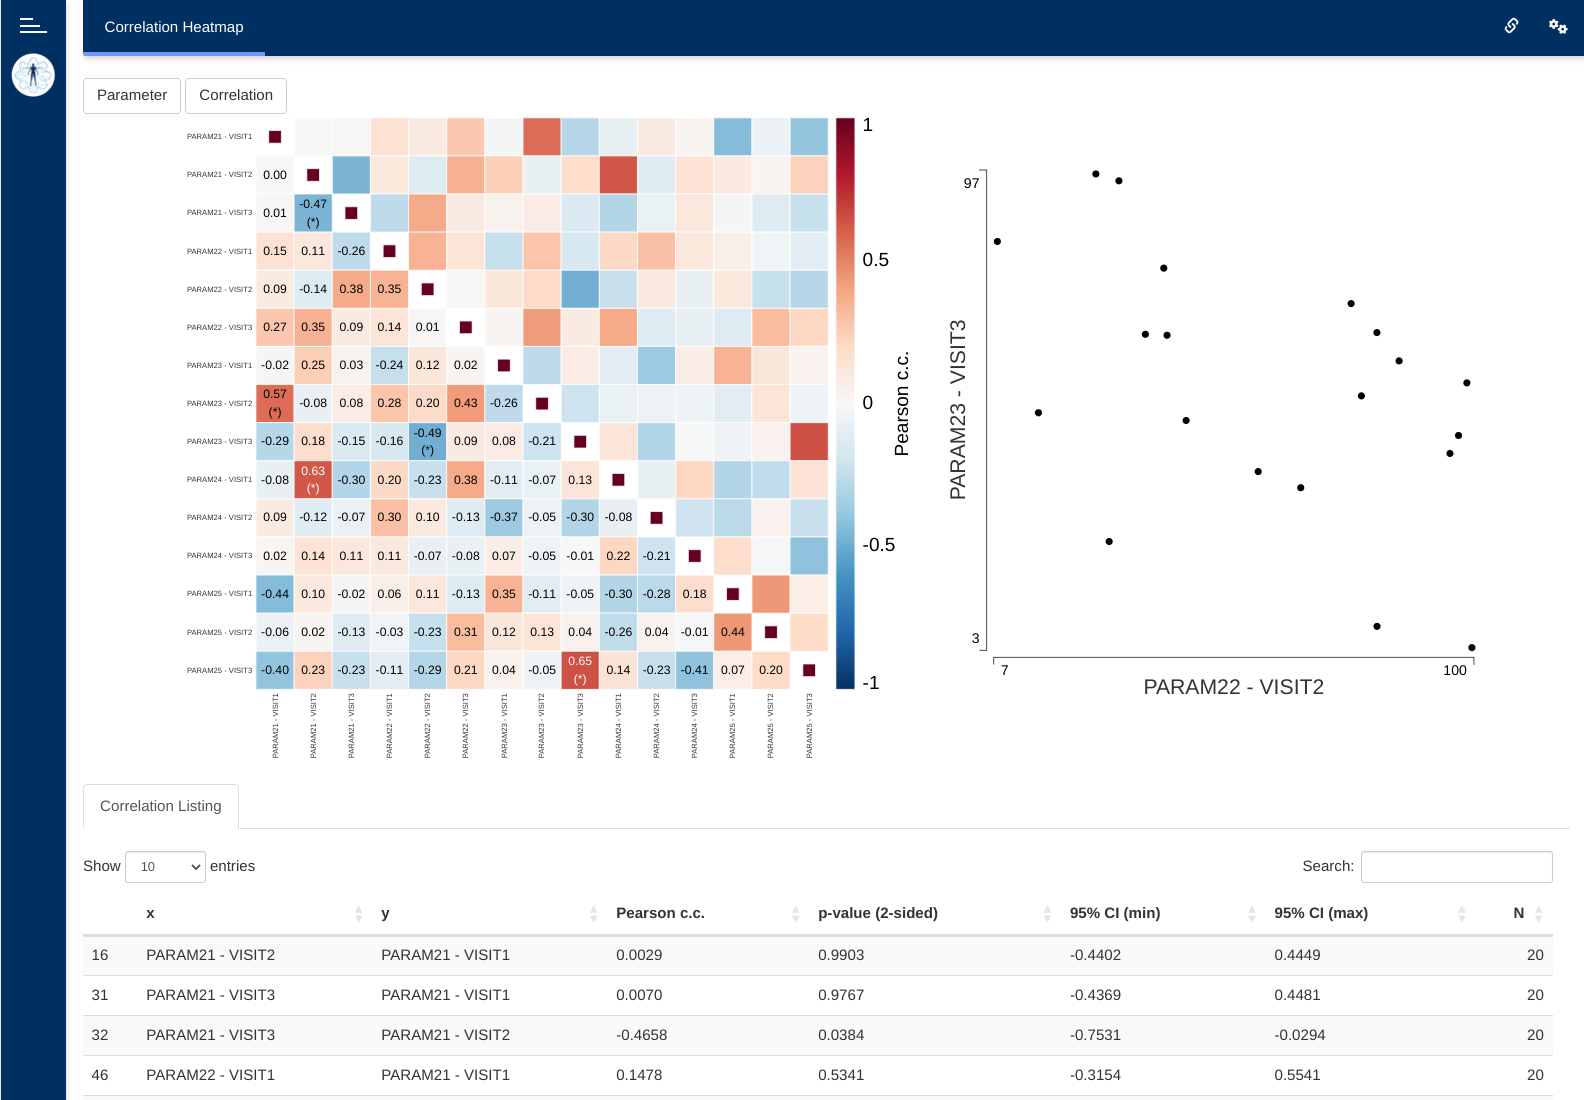
The correlation heatmap module allows examining the correlation of several parameters using a correlation heatmap with different statistical measures.
Use case: Biomarker Analysis, Parameter Exploration
eDISH by {dv.edish}
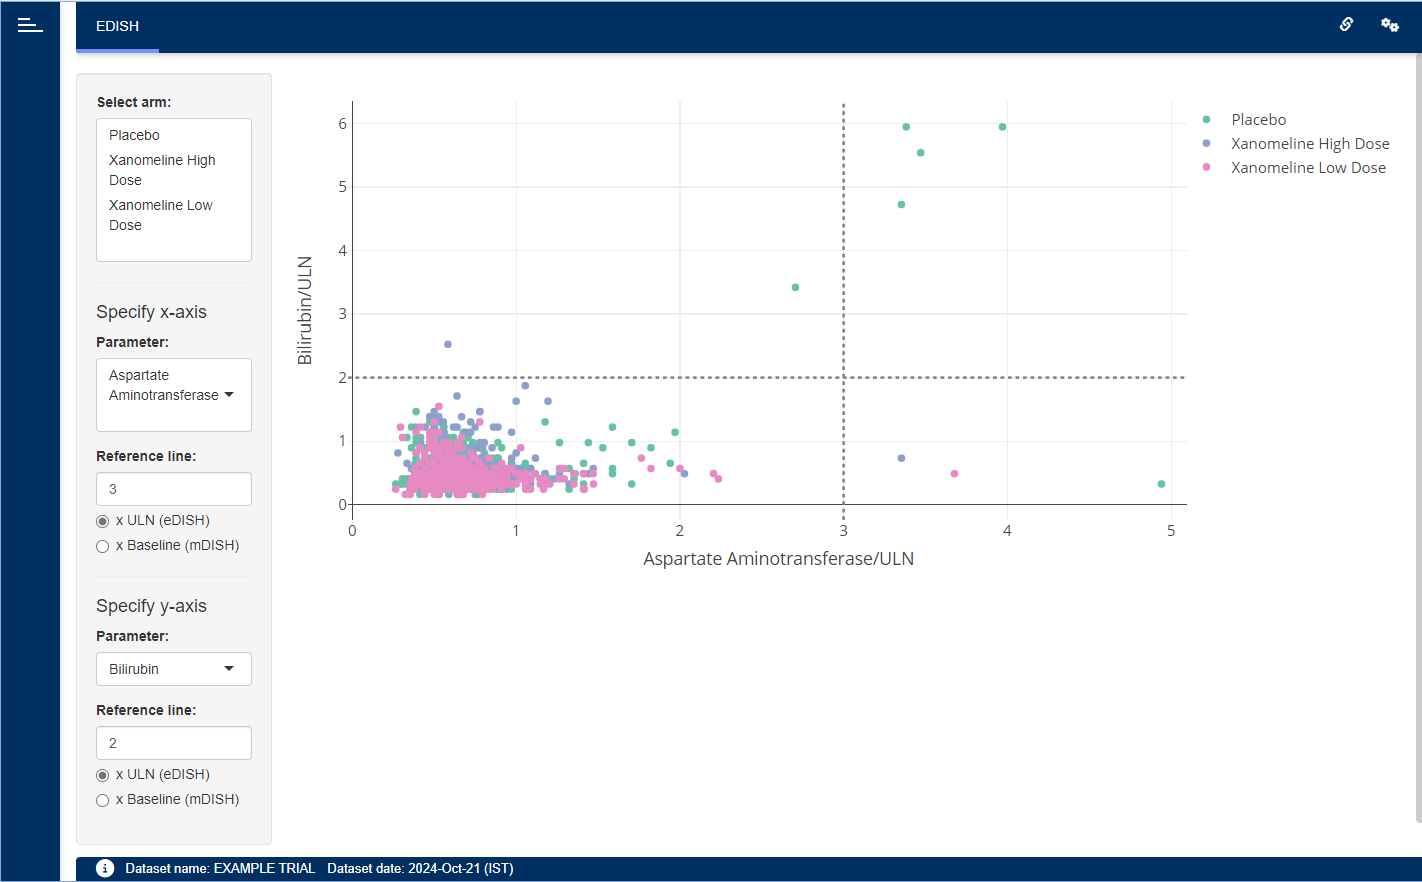
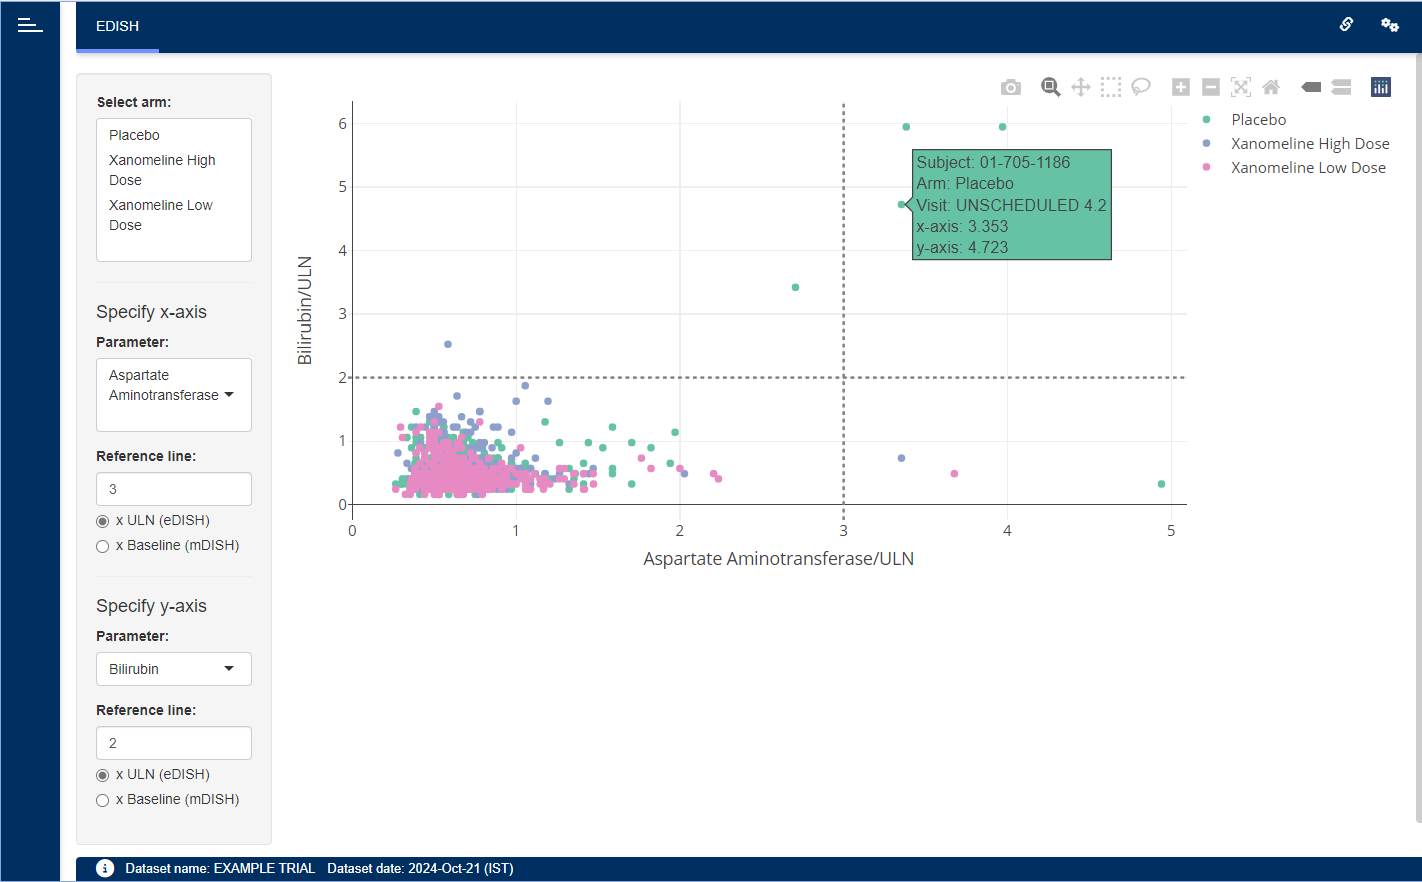
The eDISH module aims to support the assessment of drug-induced liver injury by means of the (modified) evaluation of Drug-Induced Serious Hepatotoxicity plot. It supports drill-through to Patient Profile, allowing users to click a data point and open the corresponding subject in dv.papo.
Use case: Quality Monitoring, Safety Review
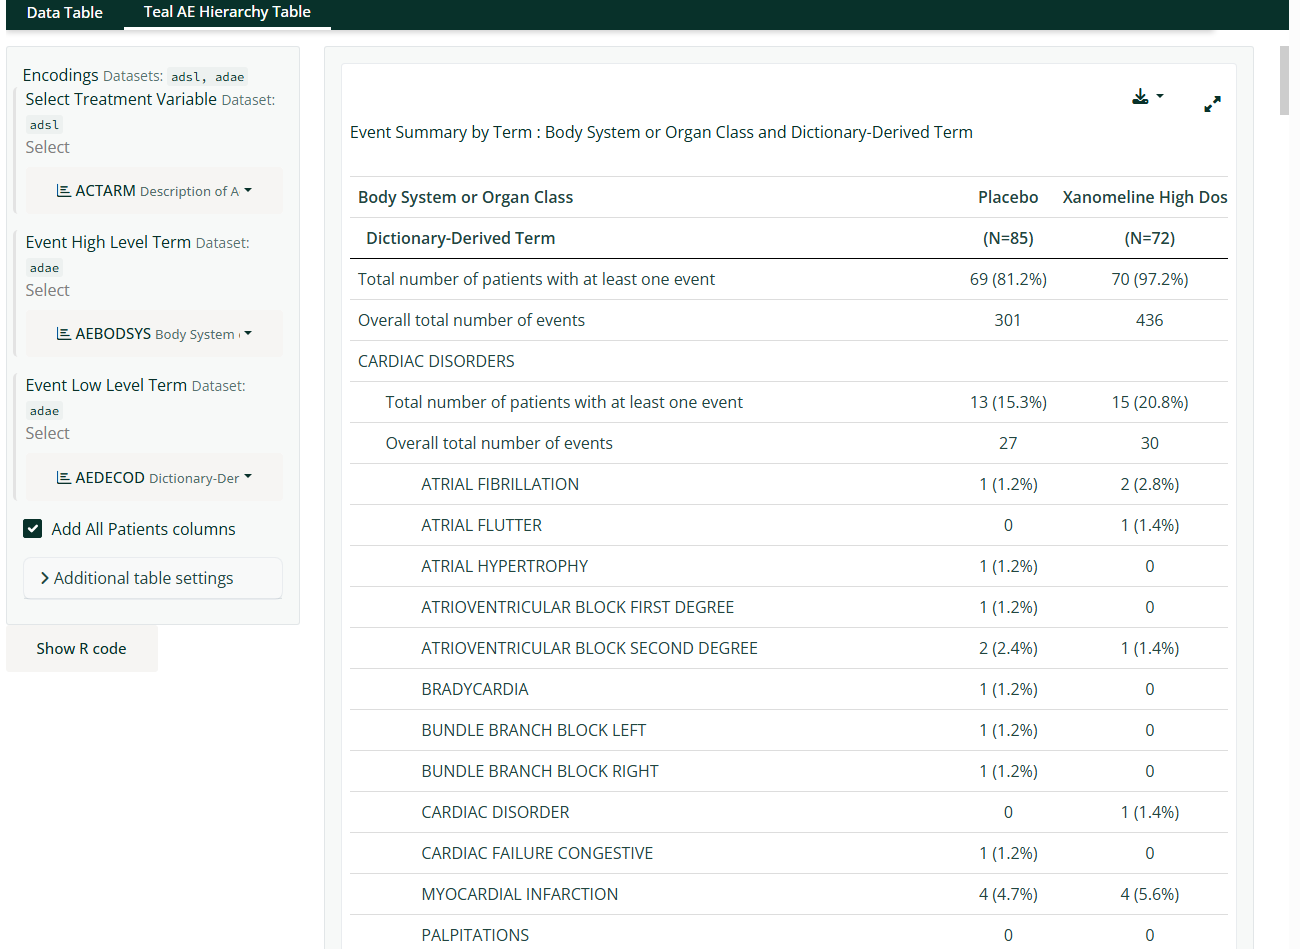
Hierarchical count table by {dv.tables}
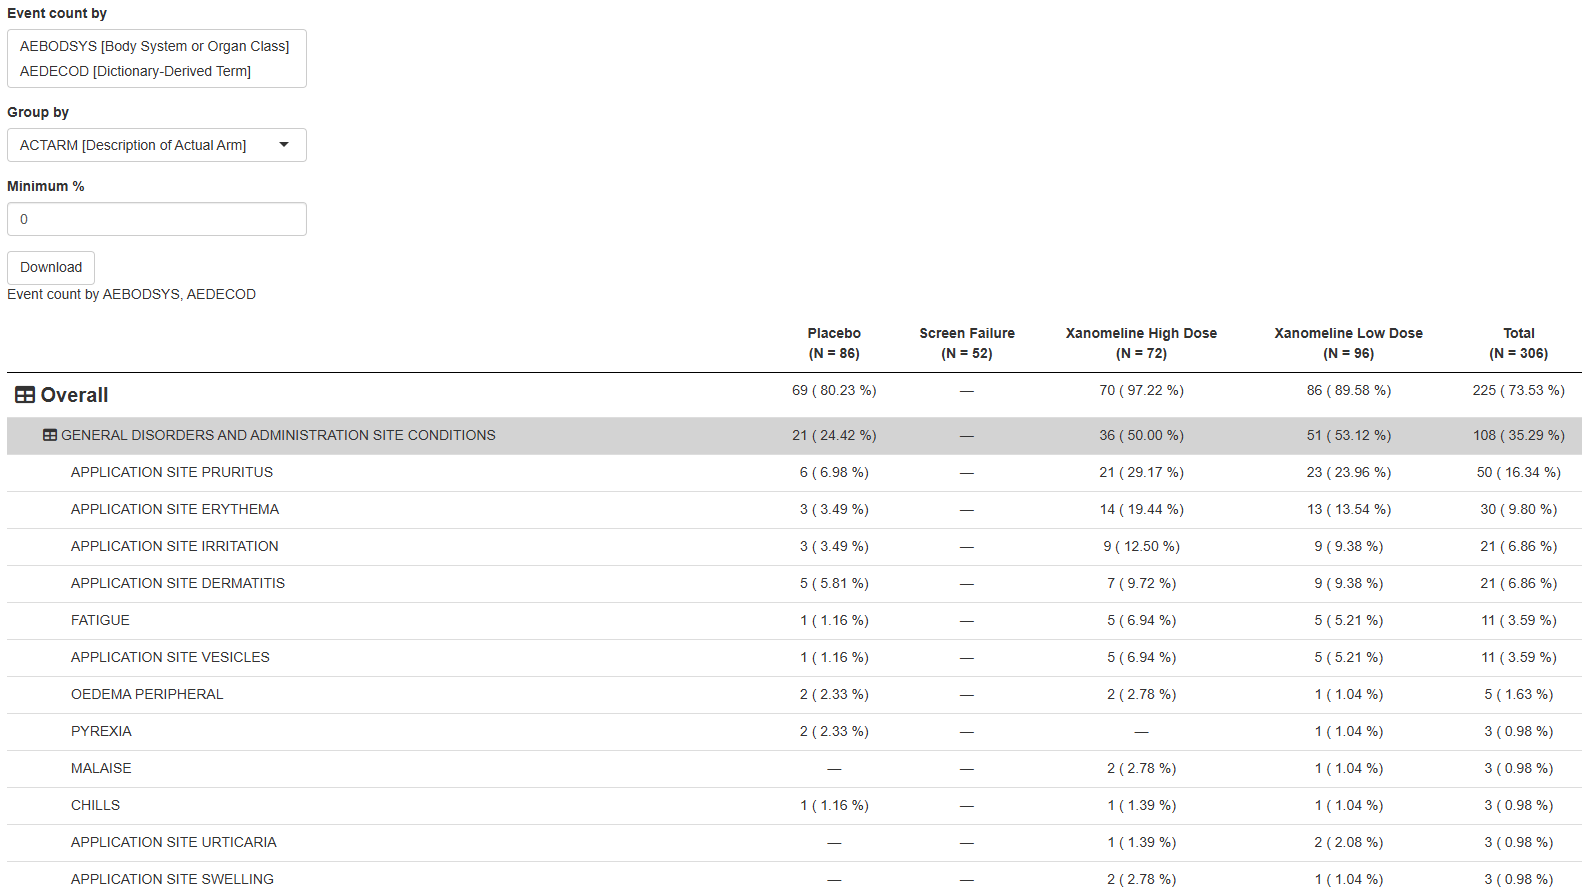
The hierarchical count table module enables the visualization of hierarchical tables, displaying event counts at each level for a clear and structured overview. It supports drill-through to Patient Profile, allowing users to click a data point and open the corresponding subject in dv.papo.
Use case: Quality Monitoring, Safety Review
Forest plot by {dv.explorer.parameter}
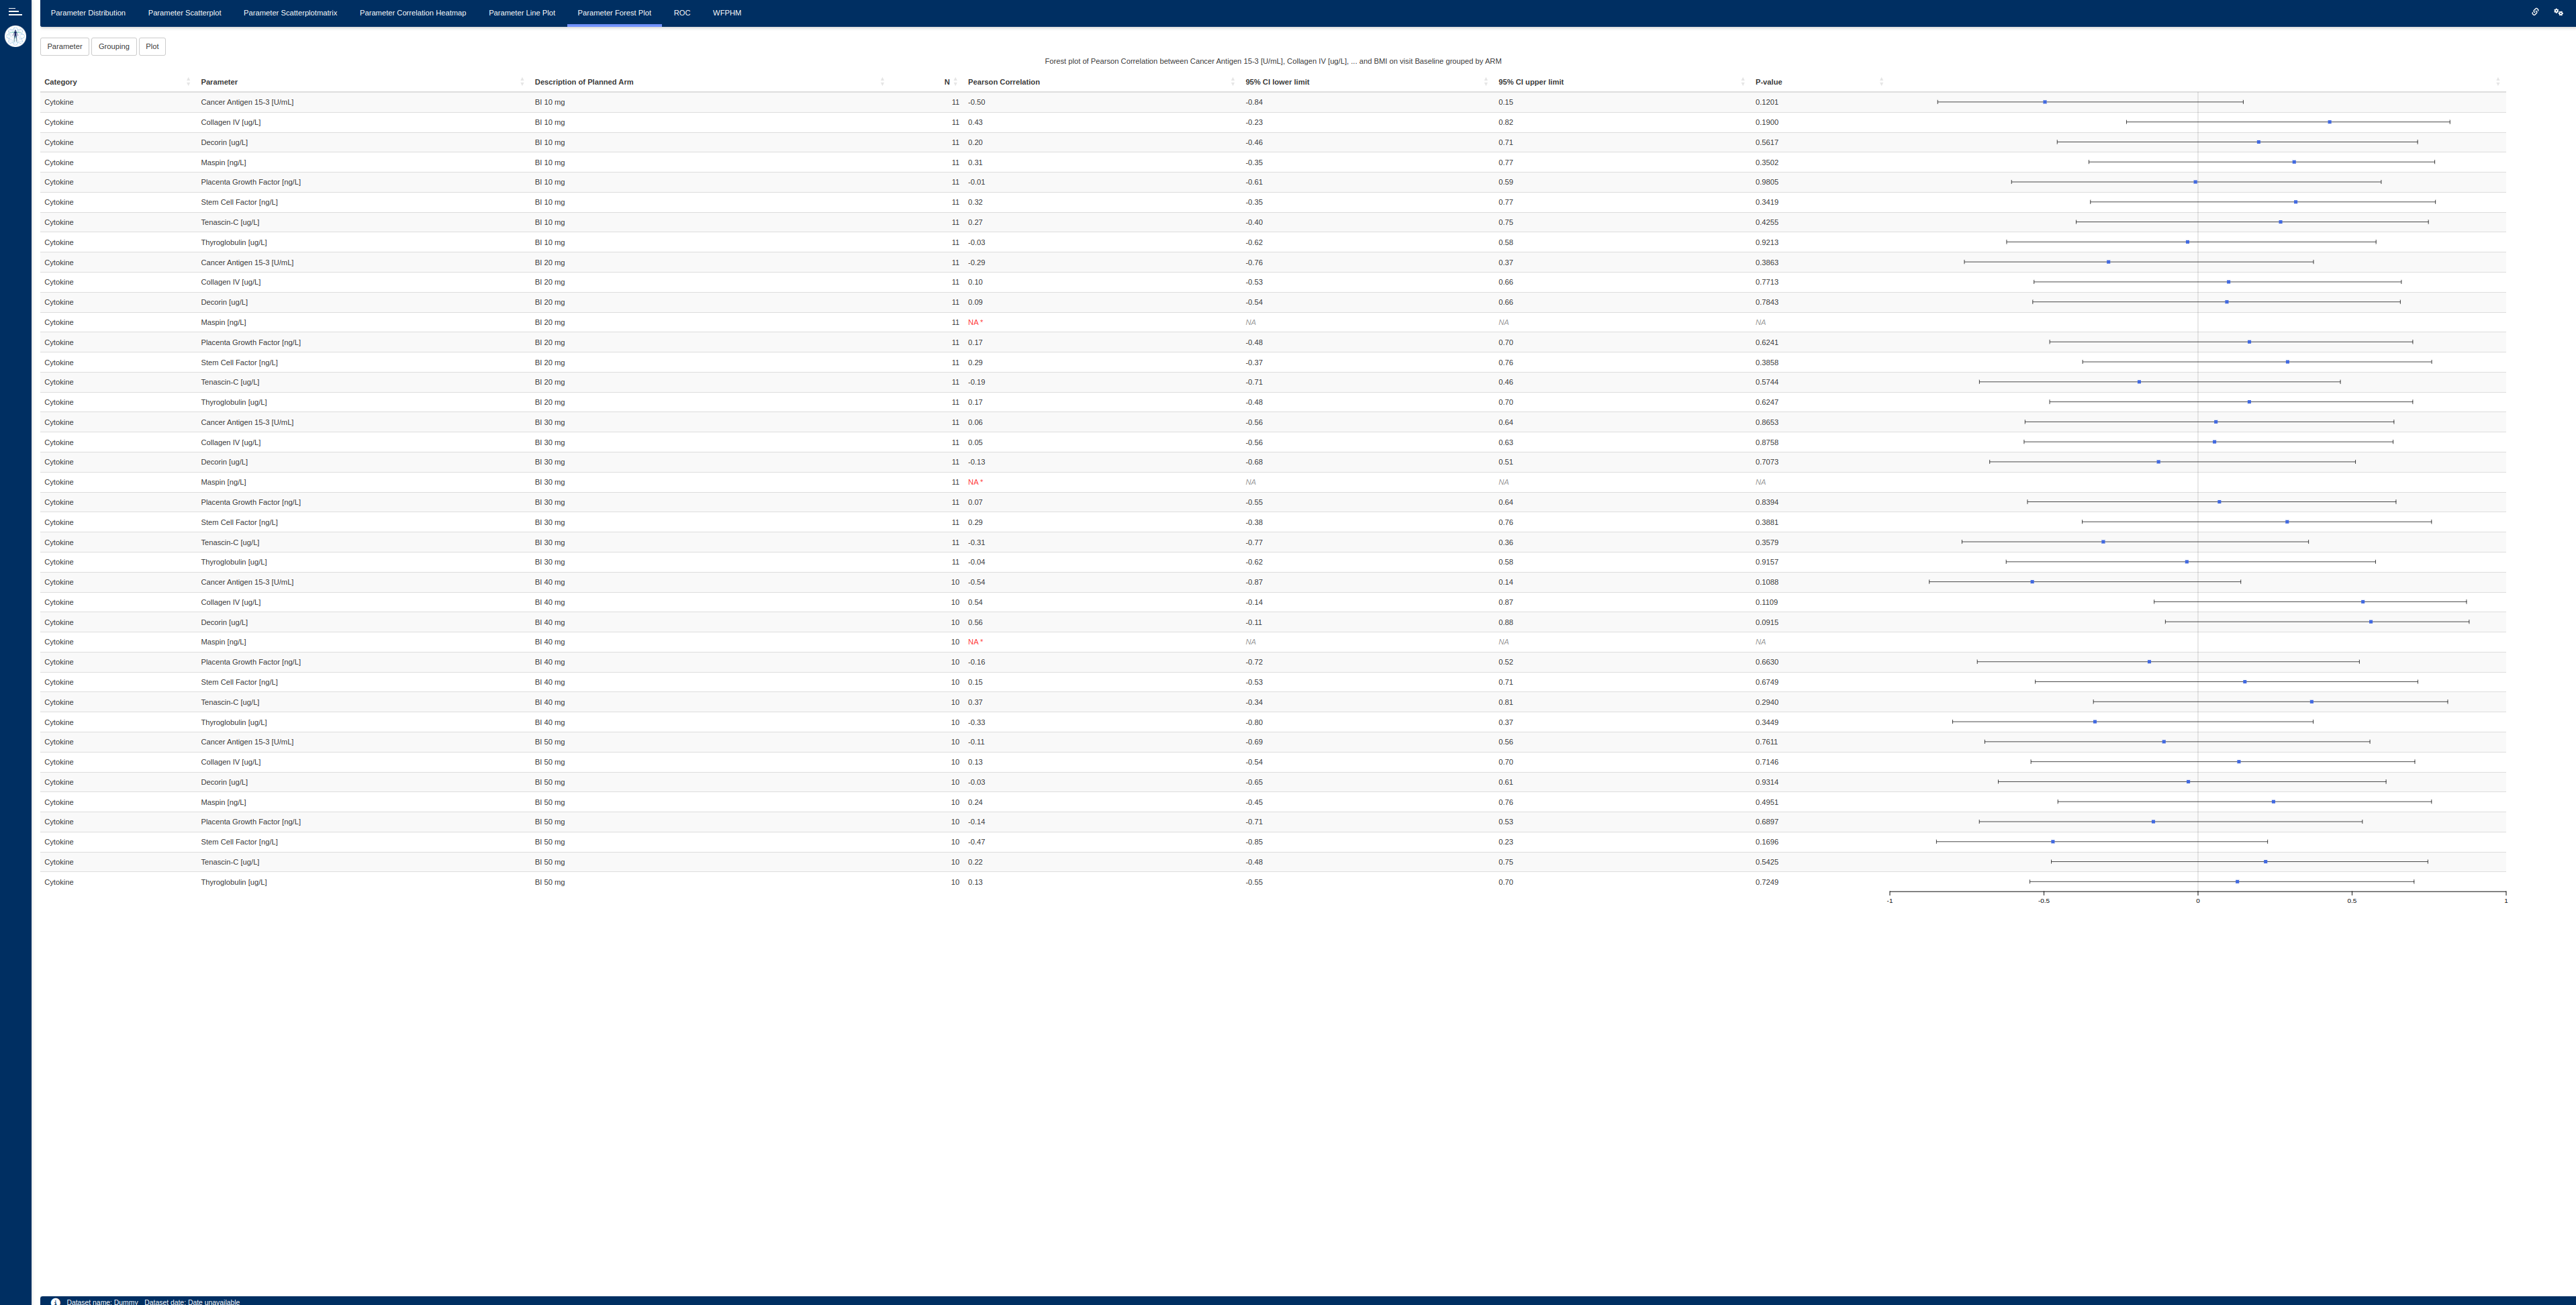
The forest plot module allows examining the correlation of several parameters with a continuous variable in the form of a forest plot. Several correlation measures and groupings are available.
Use case: Biomarker Analysis, Parameter Exploration
Line plot by {dv.explorer.parameter}
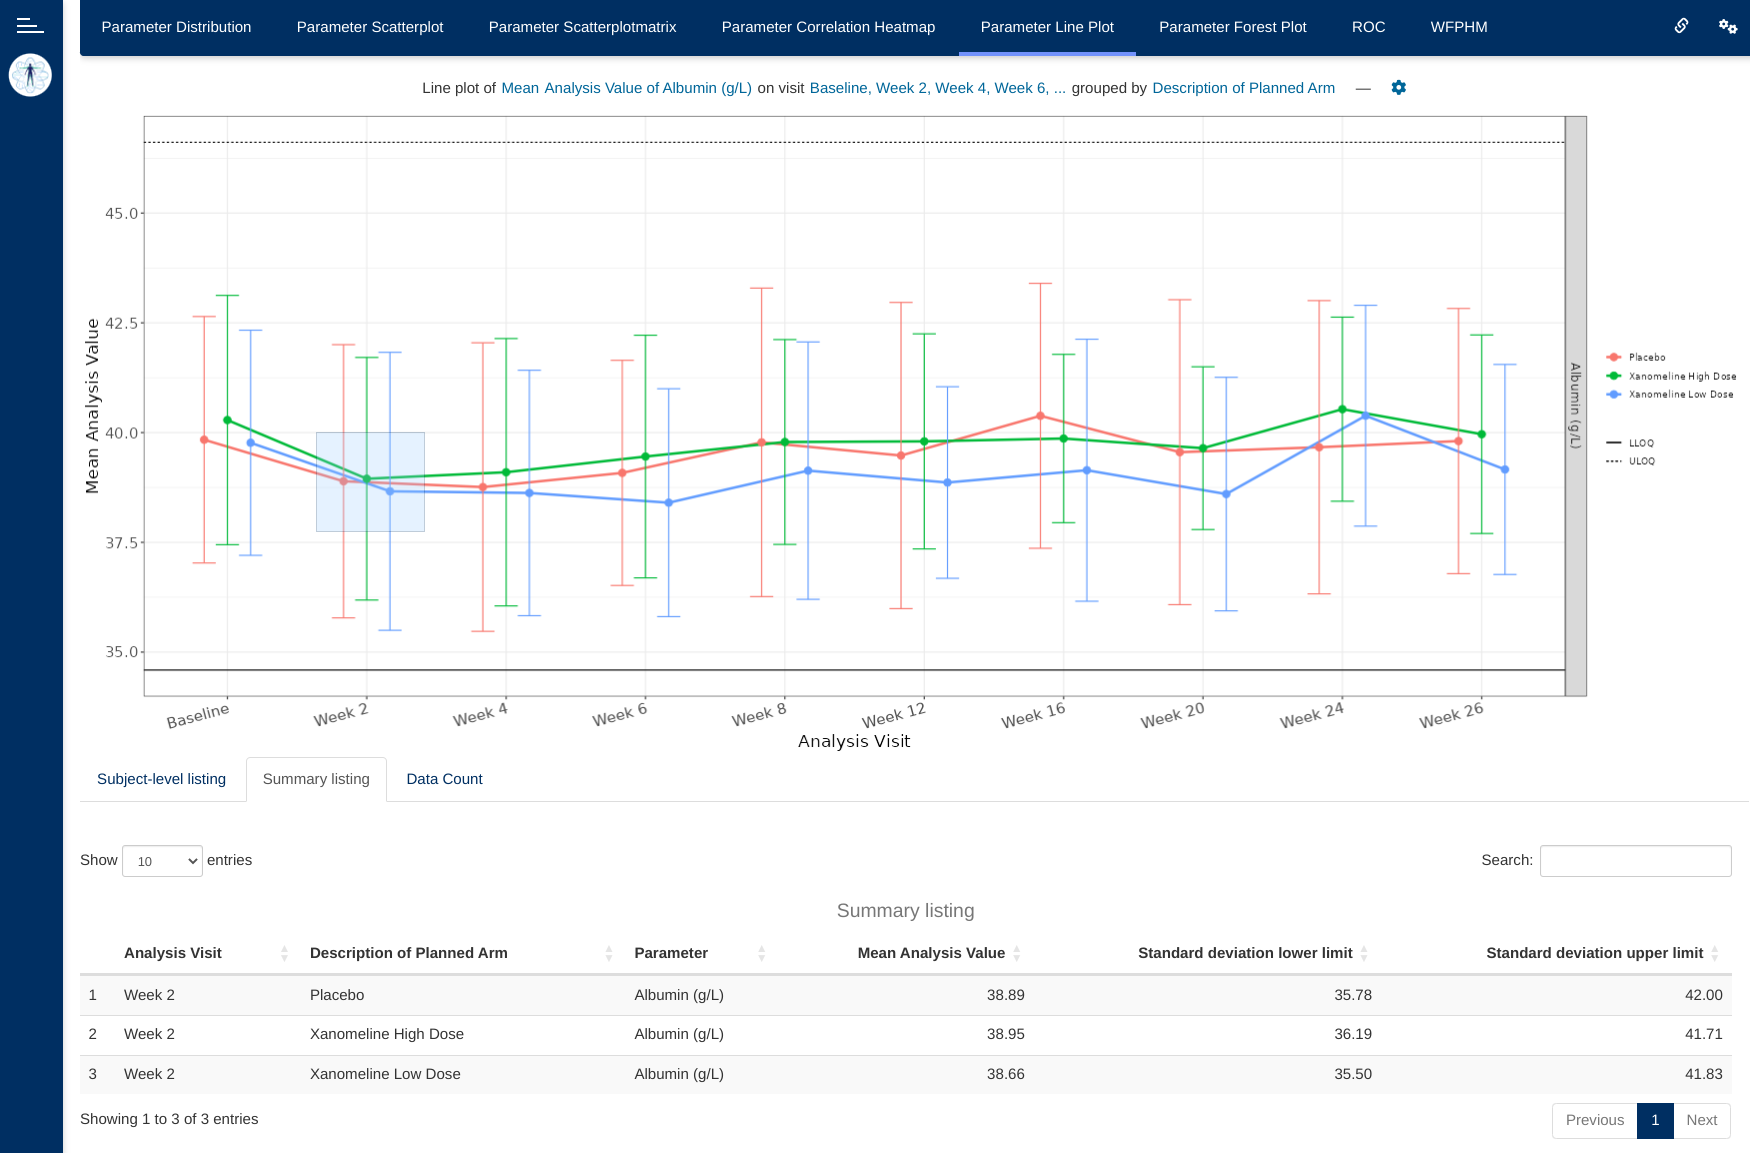
The lineplot module allows examining the evolution of parameter values along different visits, using lineplots with different levels of grouping and aggregation measures. It supports drill-through to Patient Profile, allowing users to click a data point and open the corresponding subject in dv.papo.
Use case: Safety Review, Biomarker Analysis, Parameter Exploration
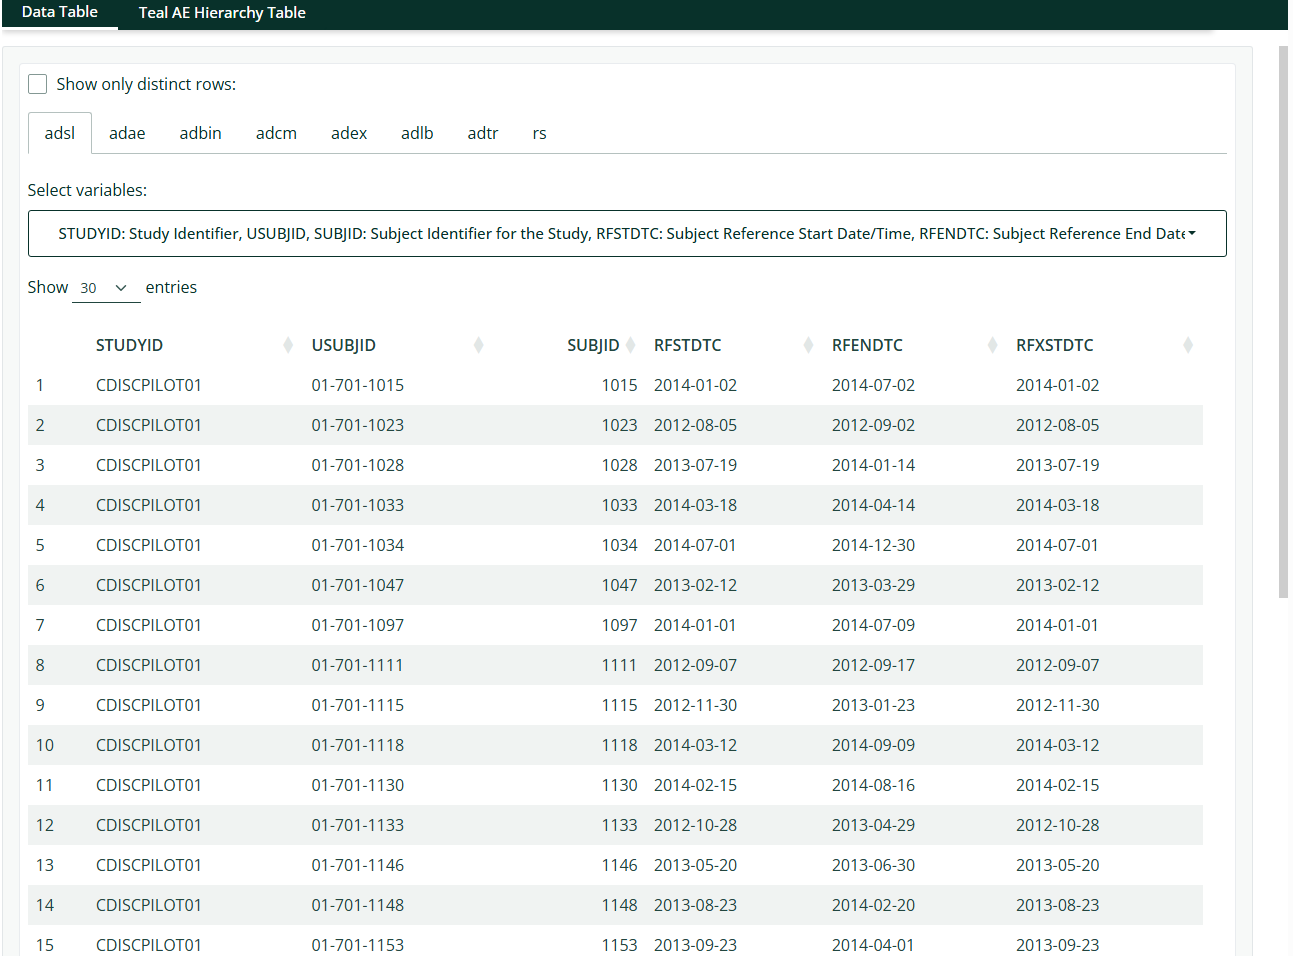
Listings by {dv.listings}
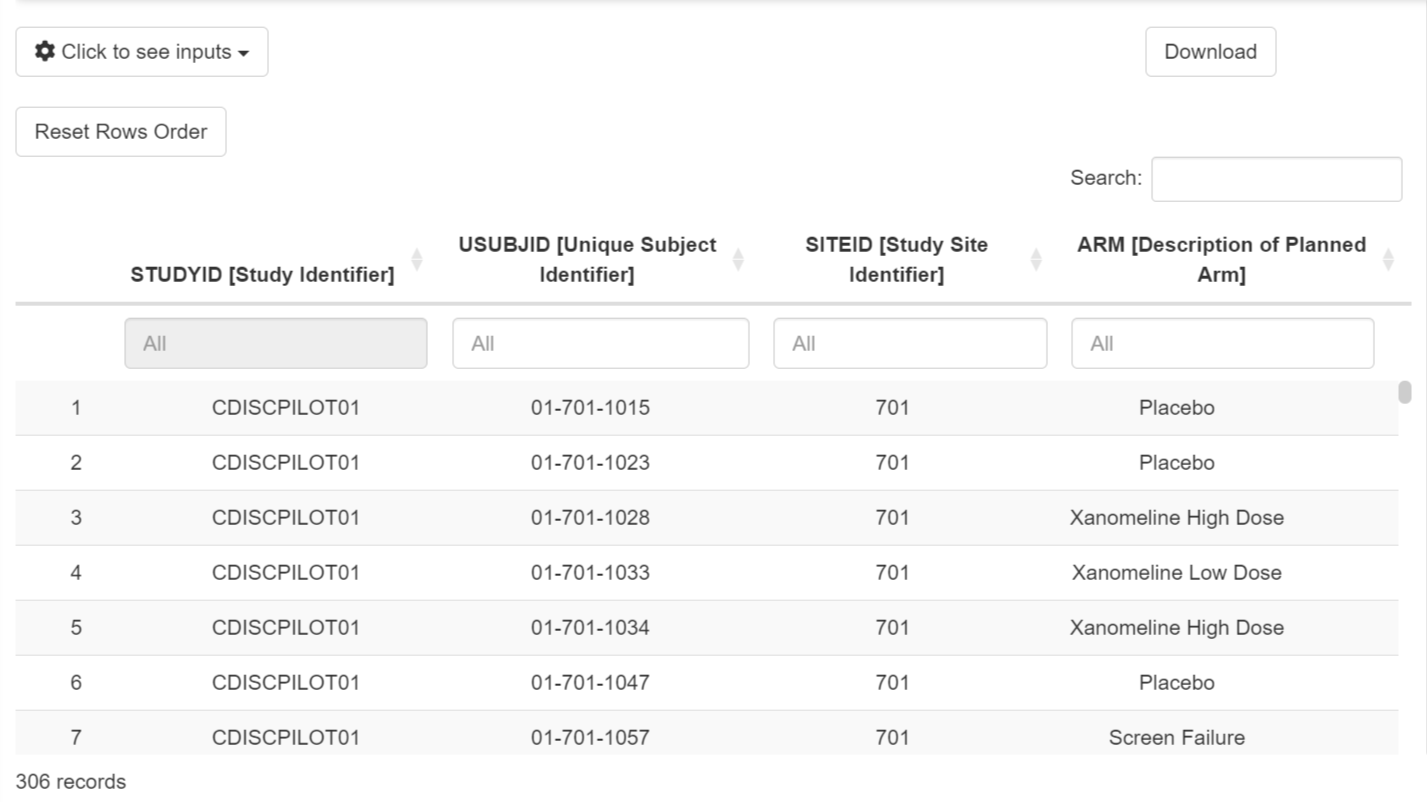
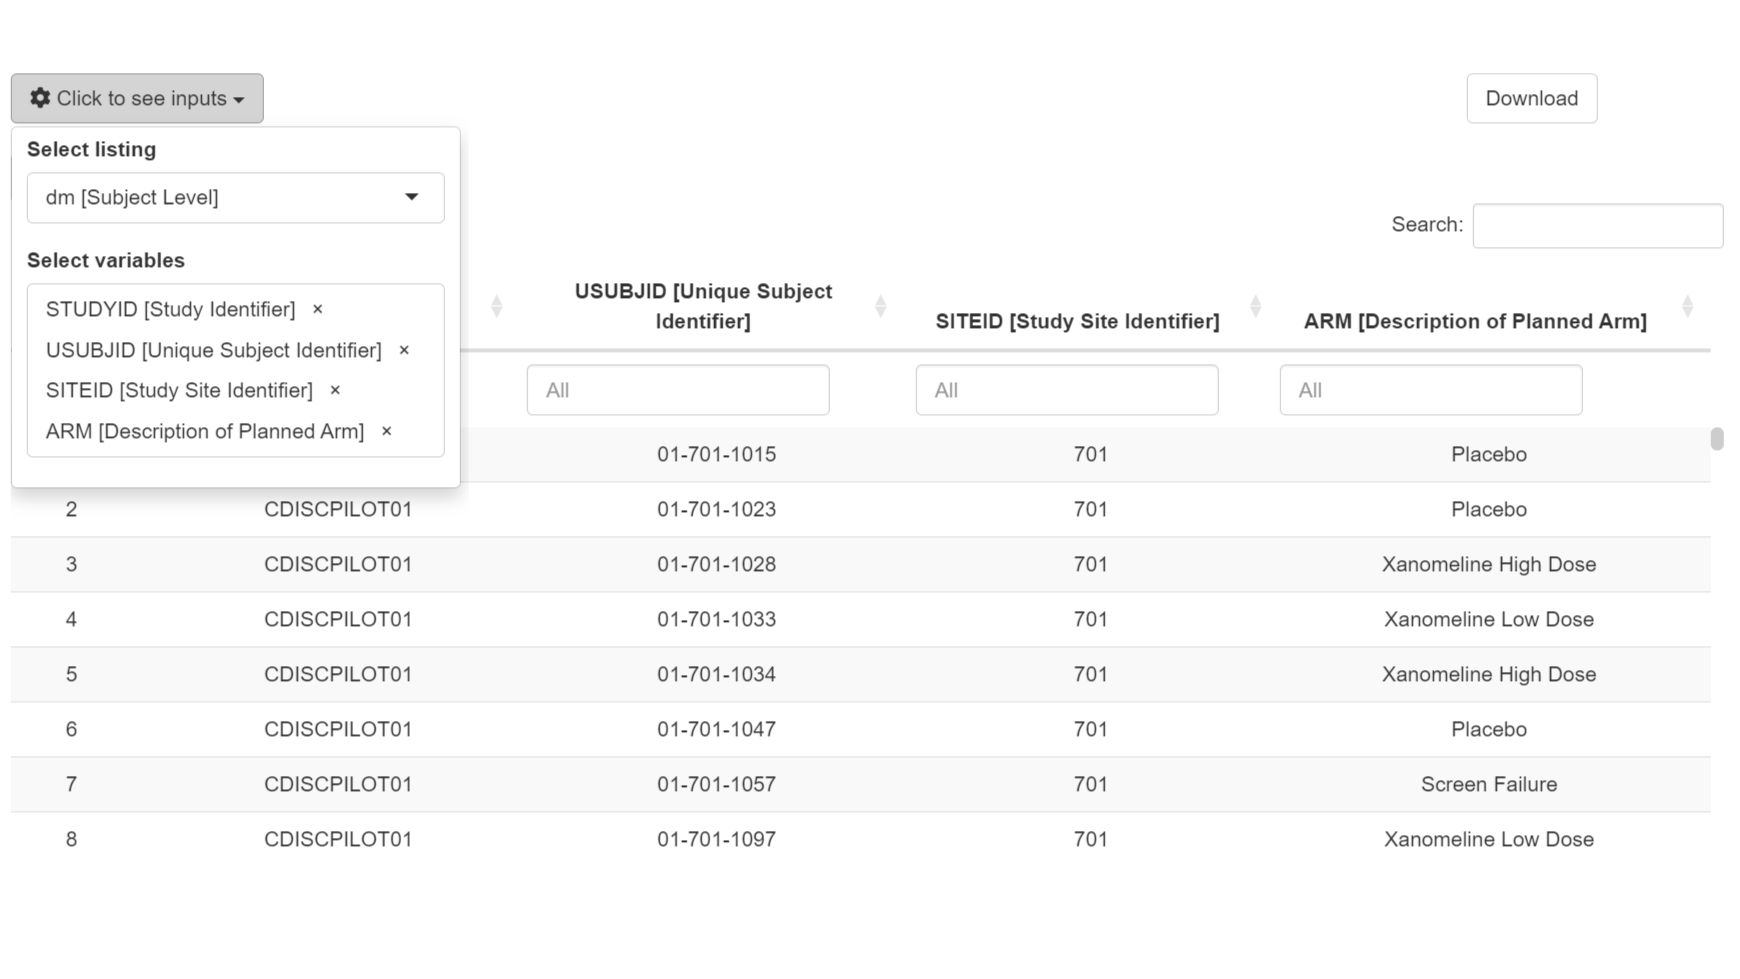
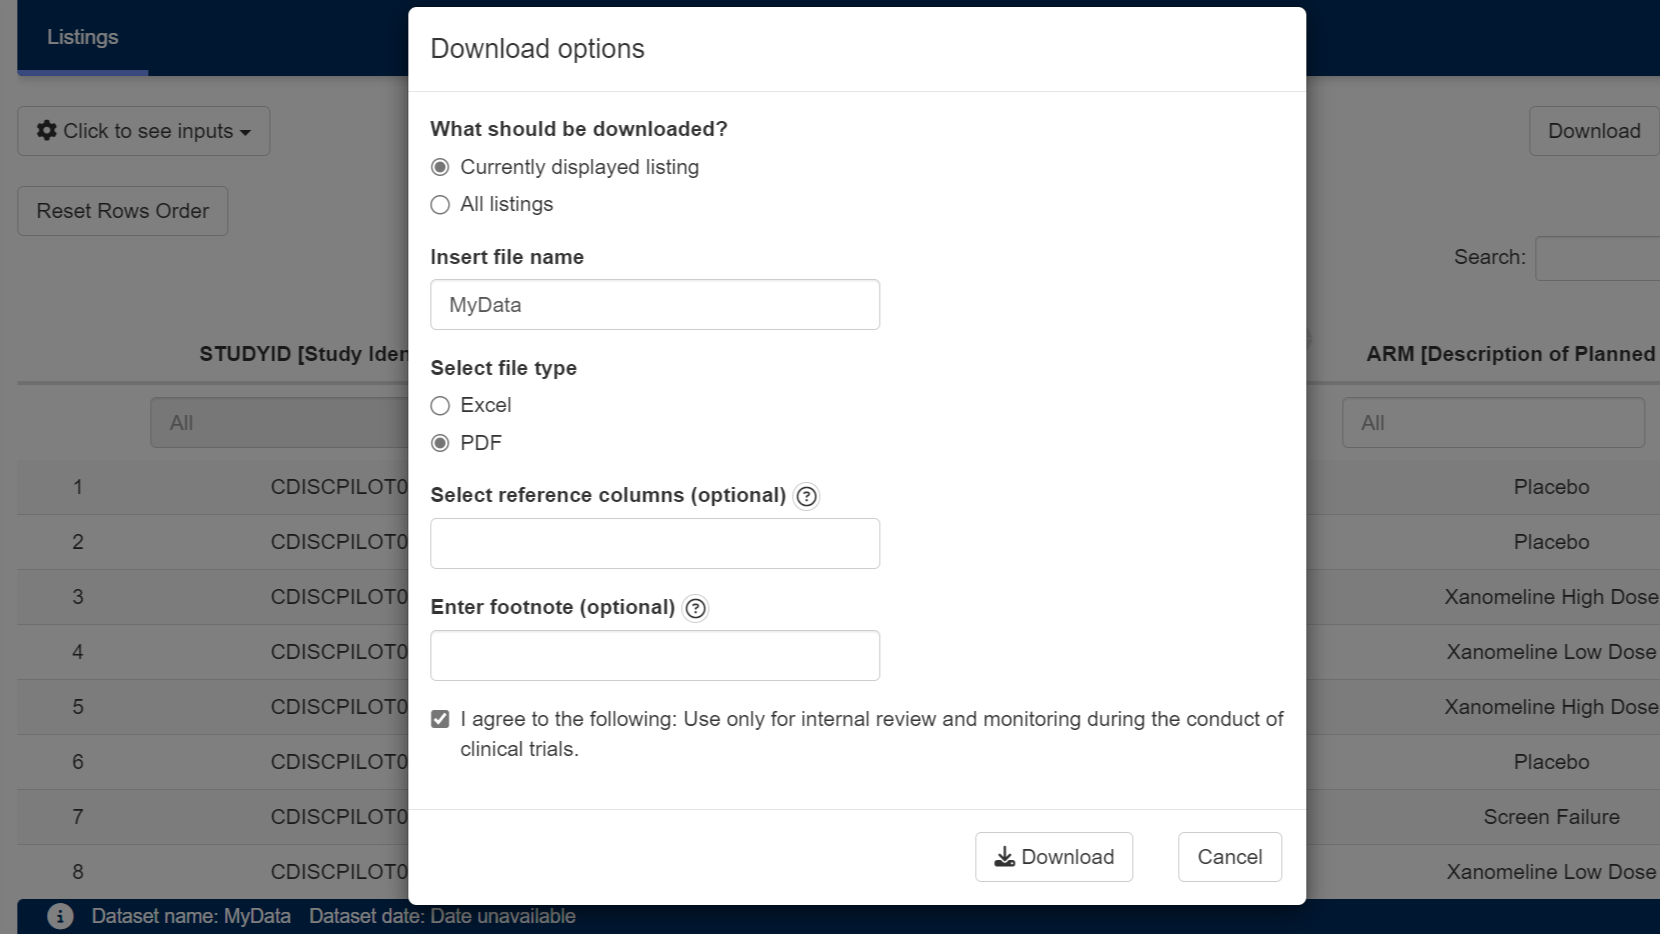
The listings module displays arbitrary datasets as listings. Users can select the dataset to be shown, and specify which columns of the dataset should be displayed as well as their order. The displayed columns can be sorted and filtered. Moreover, the table can be filtered to show only entries containing a keyword entered by the user. The module is not limited to usage of one data source, most notably, it can handle data from ADaM or SDTM. It supports drill-through to Patient Profile, allowing users to click a data point and open the corresponding subject in dv.papo.
Use case: Quality Monitoring, Safety Review
Patient profile by {dv.papo}
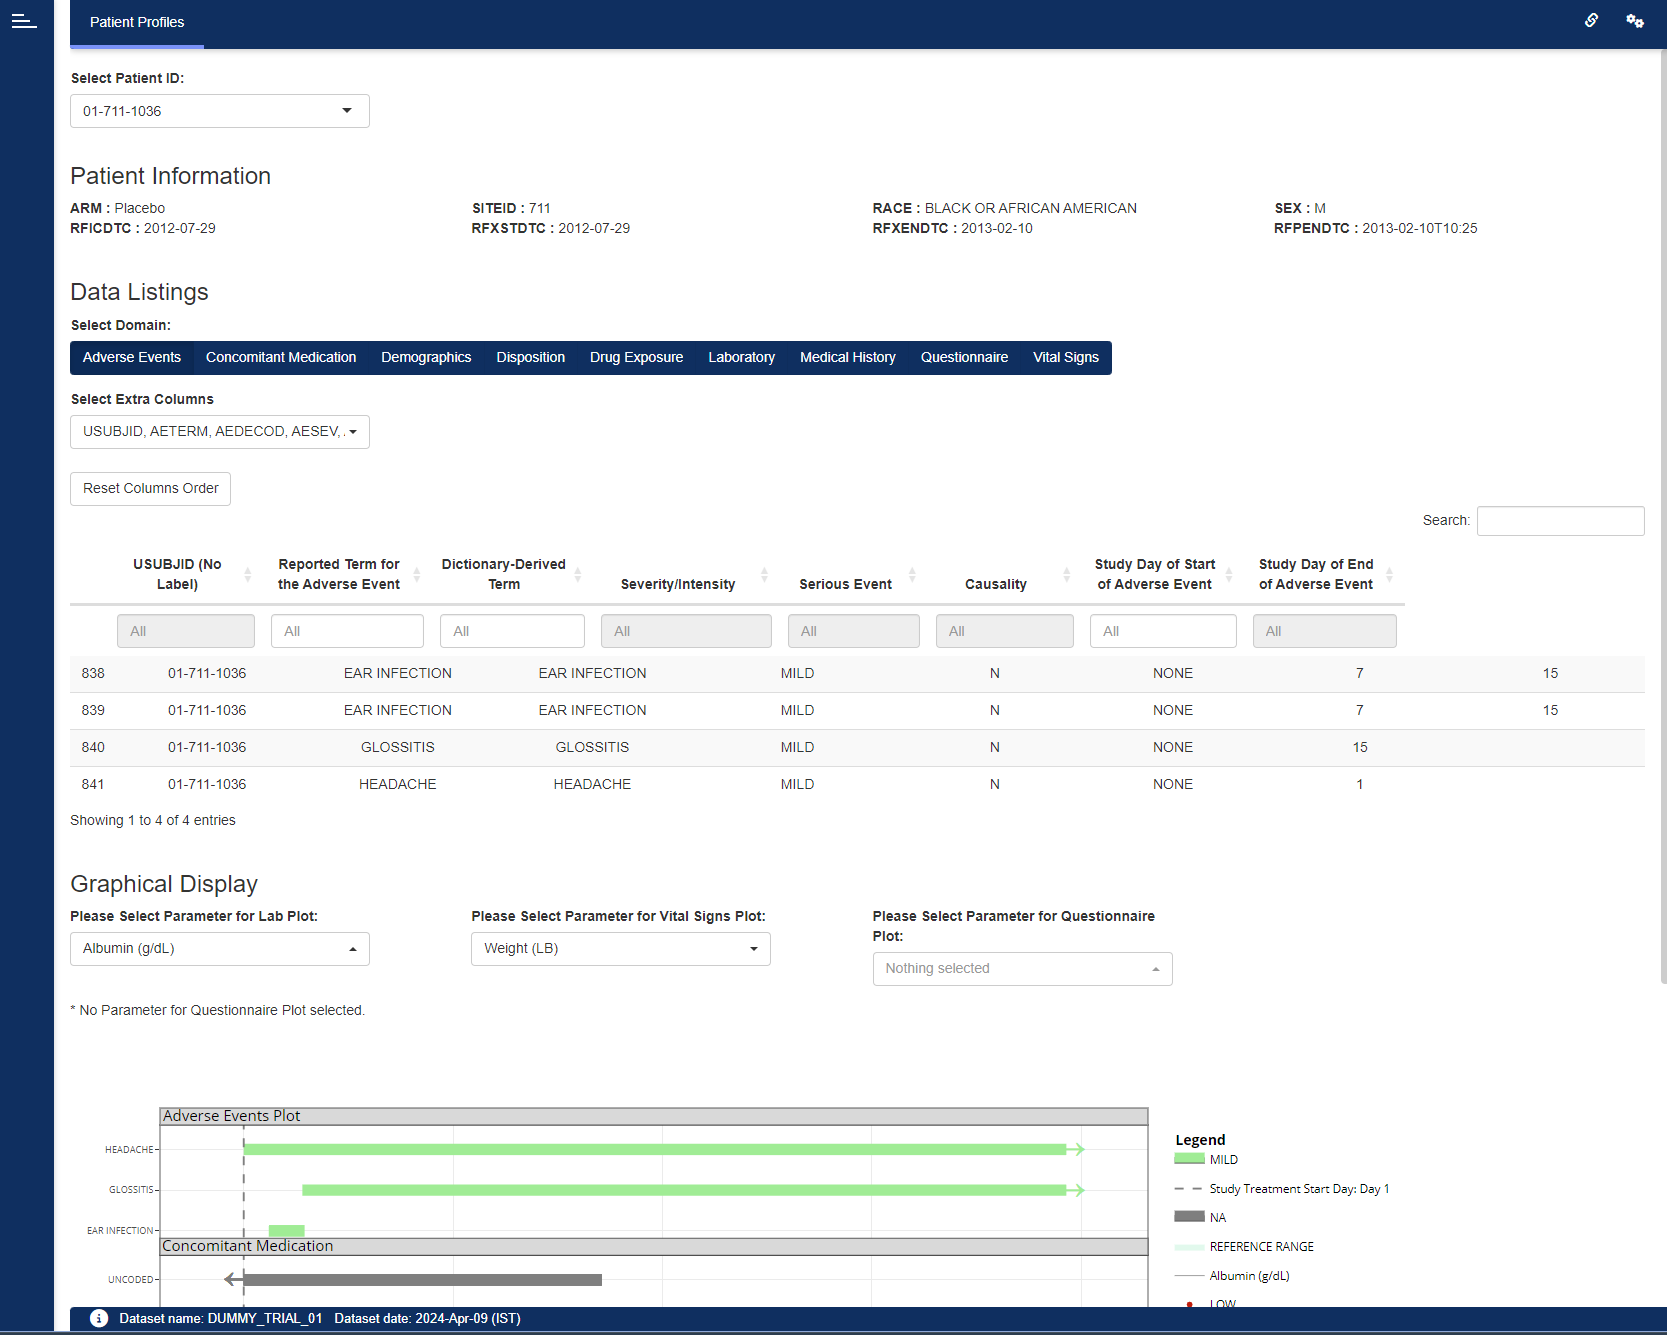
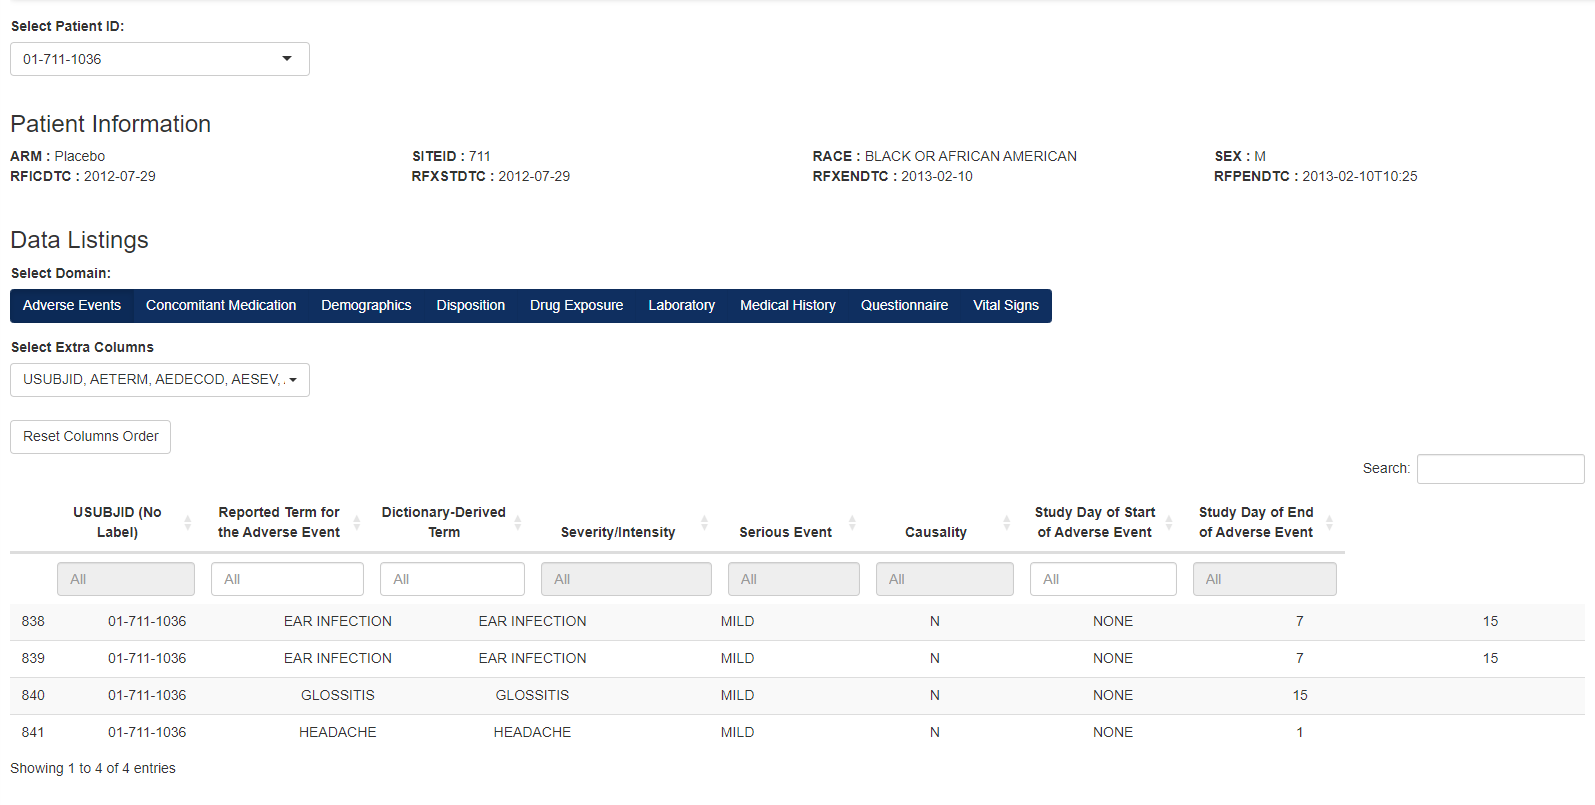
- Patient Information: Overview of general subject details (gender, age) customizable by App Creator
- Data Listings: Tabular subject data (adverse events, concomitant medications, vital signs)
- Graphical Display: Plots of adverse events, lab values, and vital signs over time
It can be reached via drill-through navigation from several other modules, enabling direct access to the corresponding patient profile.
Use case: Quality Monitoring, Safety Review
ROC by {dv.explorer.parameter}
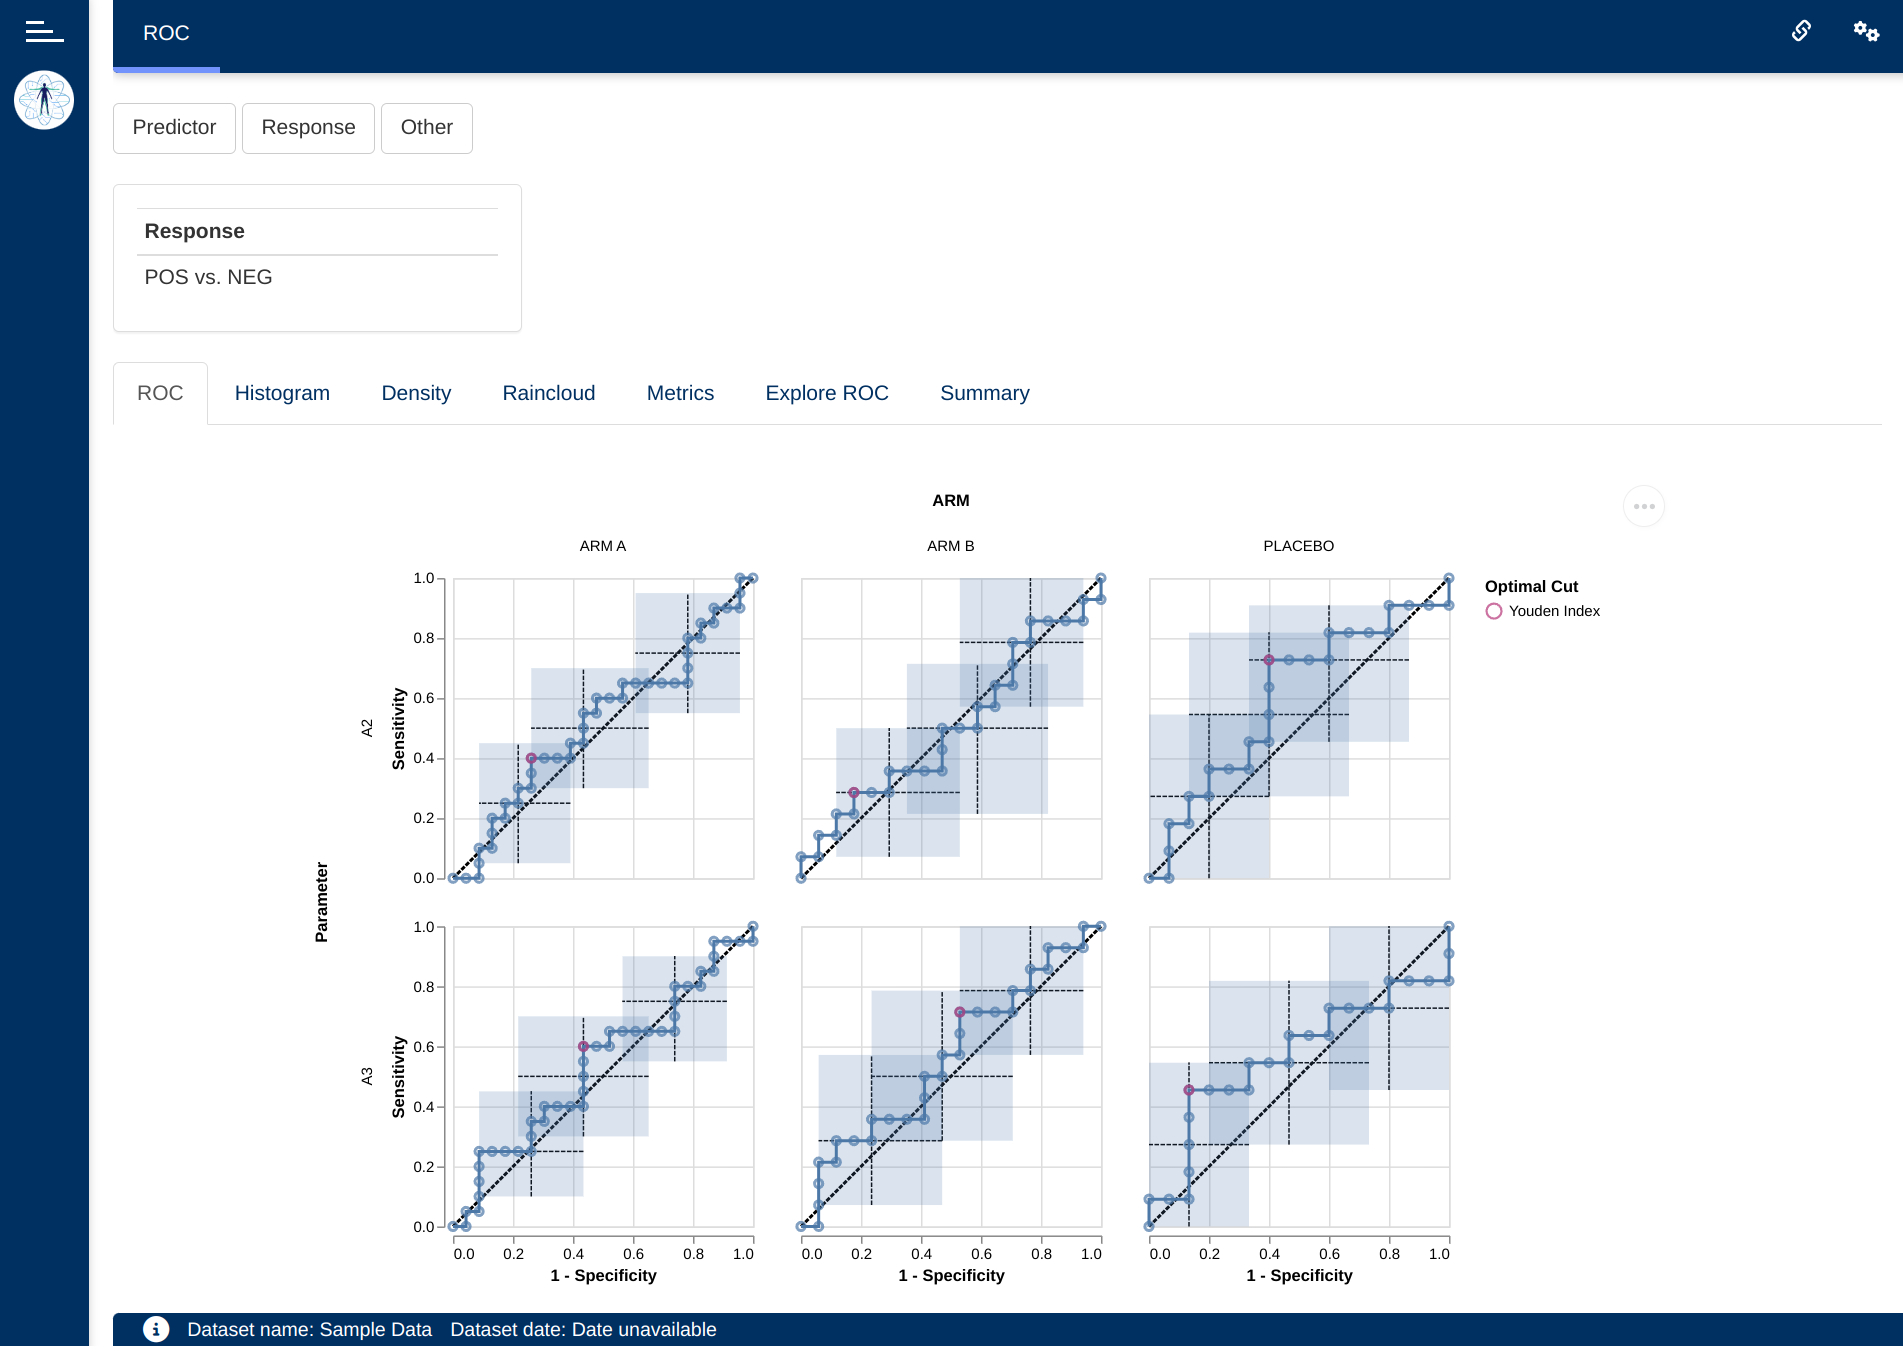
The ROC module makes it possible to visualize a set of ROC related charts, or tables, and compare independent ROC curves for different continuous parameters with respect to a single binary endpoint. This allows a user to evaluate how predictive is a continuous parameter of binary endpoint.
Use case: Biomarker Analysis, Parameter Exploration
Scatter plot by {dv.explorer.parameter}
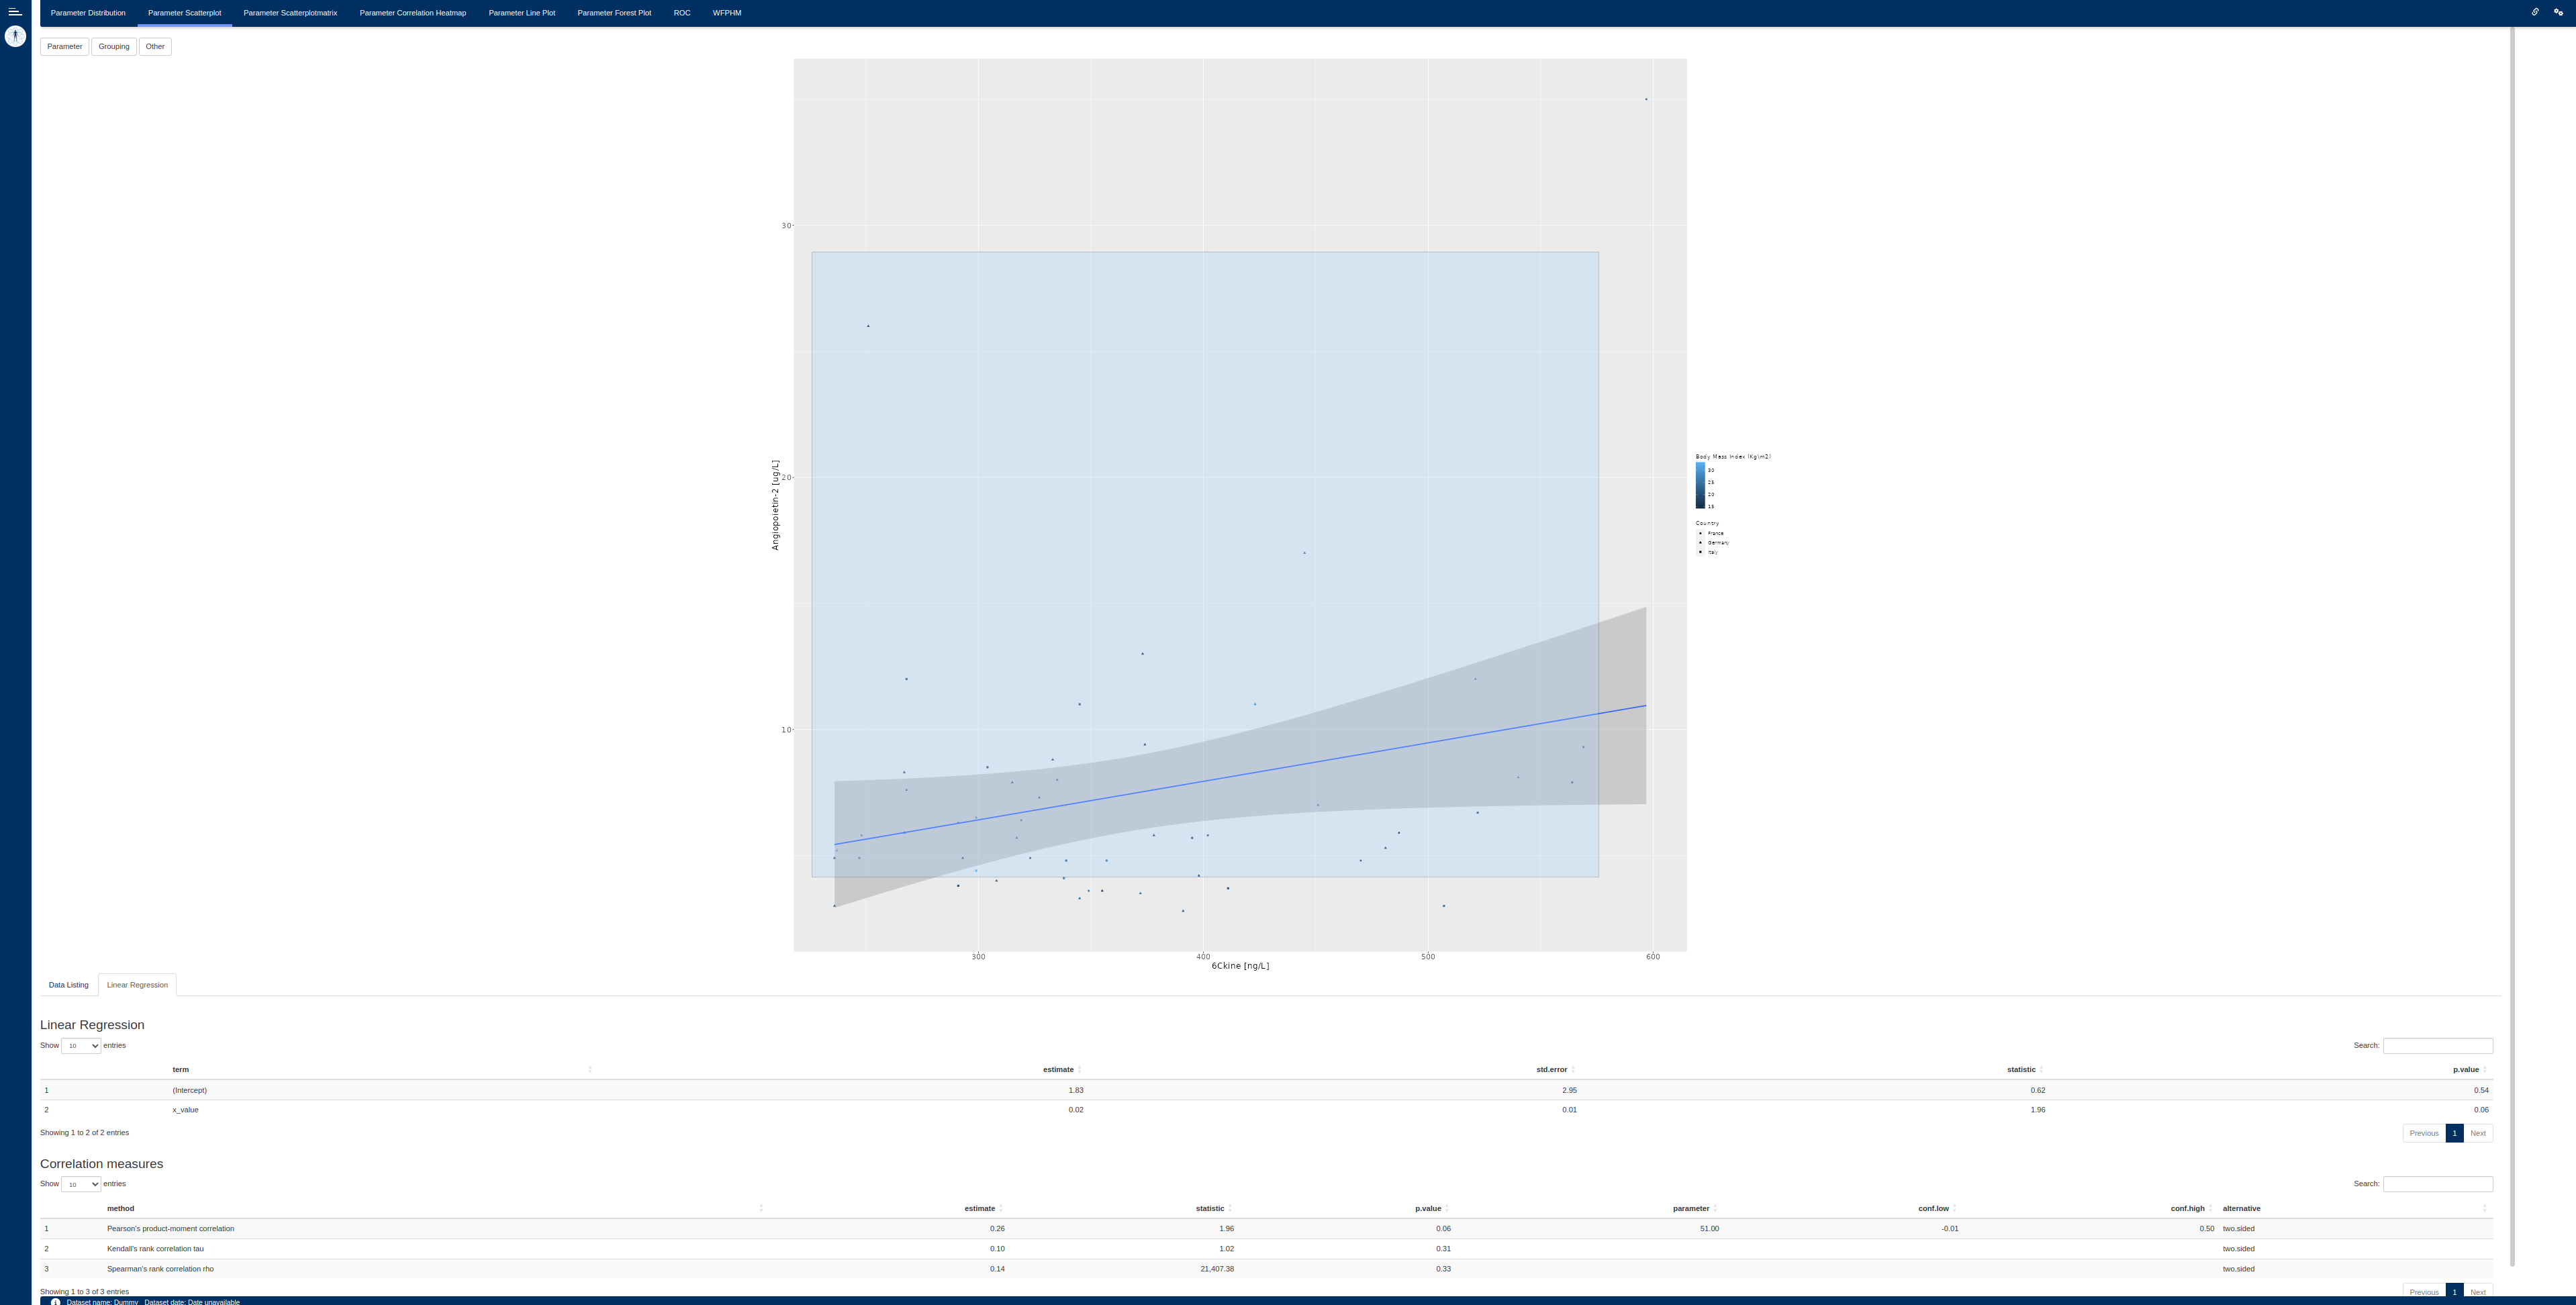
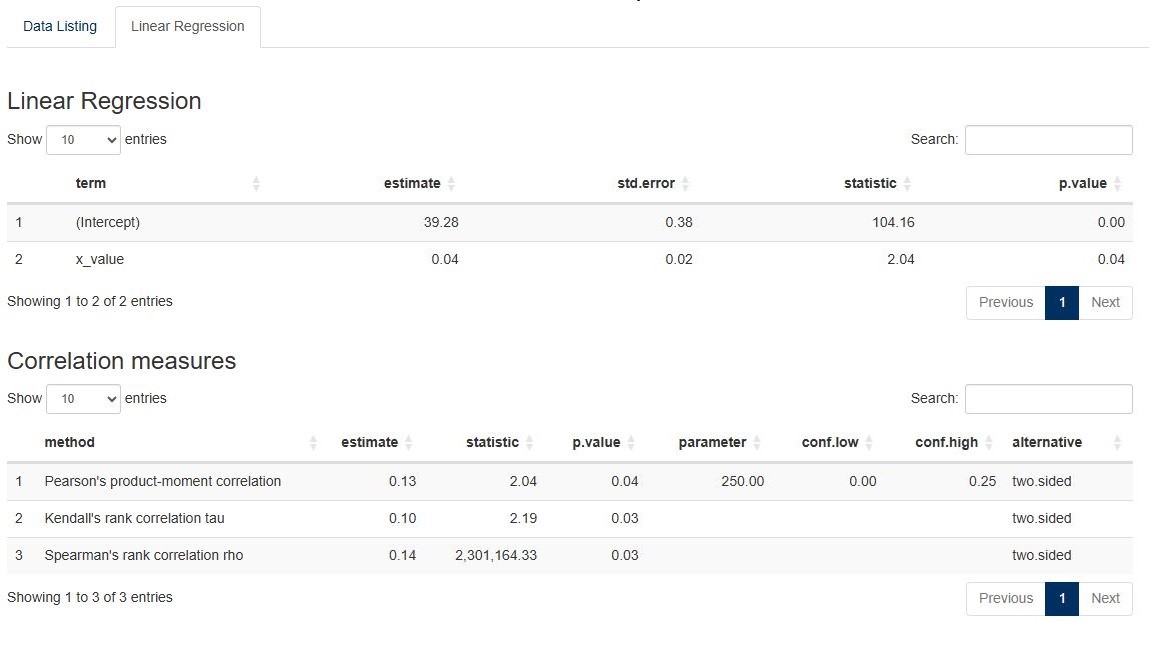
The scatterplot module visualizes relationships between two biomarkers using scatterplots with multiple grouping levels and correlation measures.
Use case: Biomarker Analysis, Parameter Exploration
Scatter plot matrix by {dv.explorer.parameter}
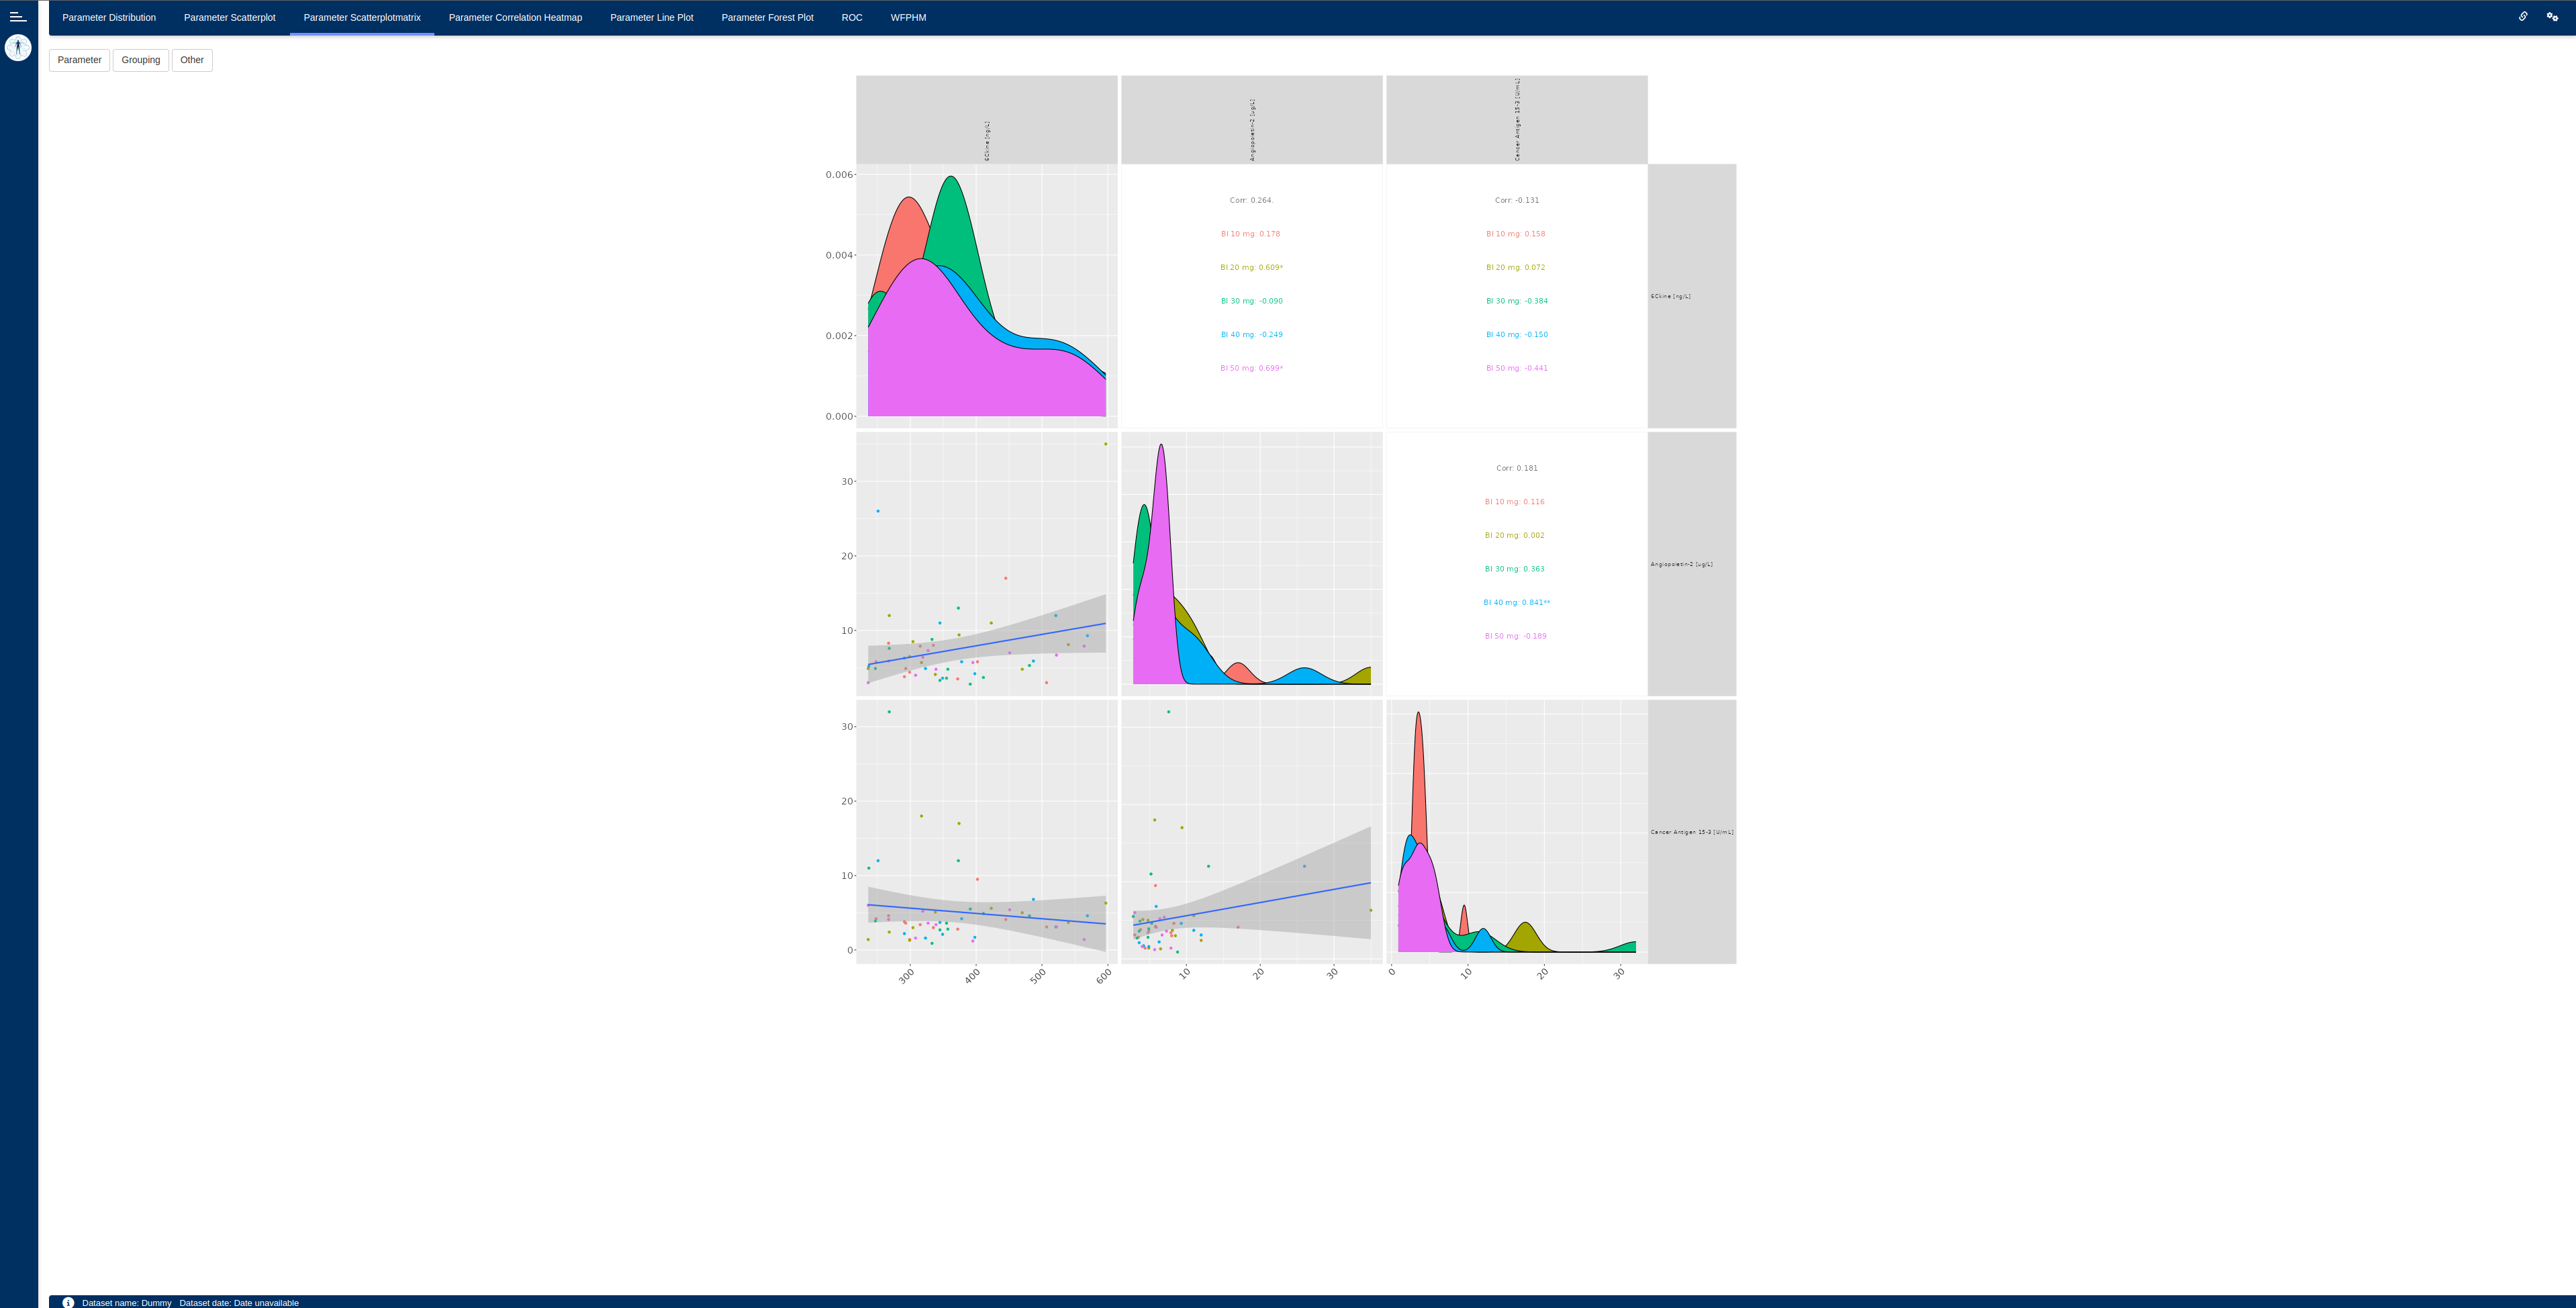
The scatter module allows examining the correlation of several parameters using a scatterplot matrix with different levels of grouping.
Use case: Biomarker Analysis, Parameter Exploration
Spider plot by {dv.spiderplot}
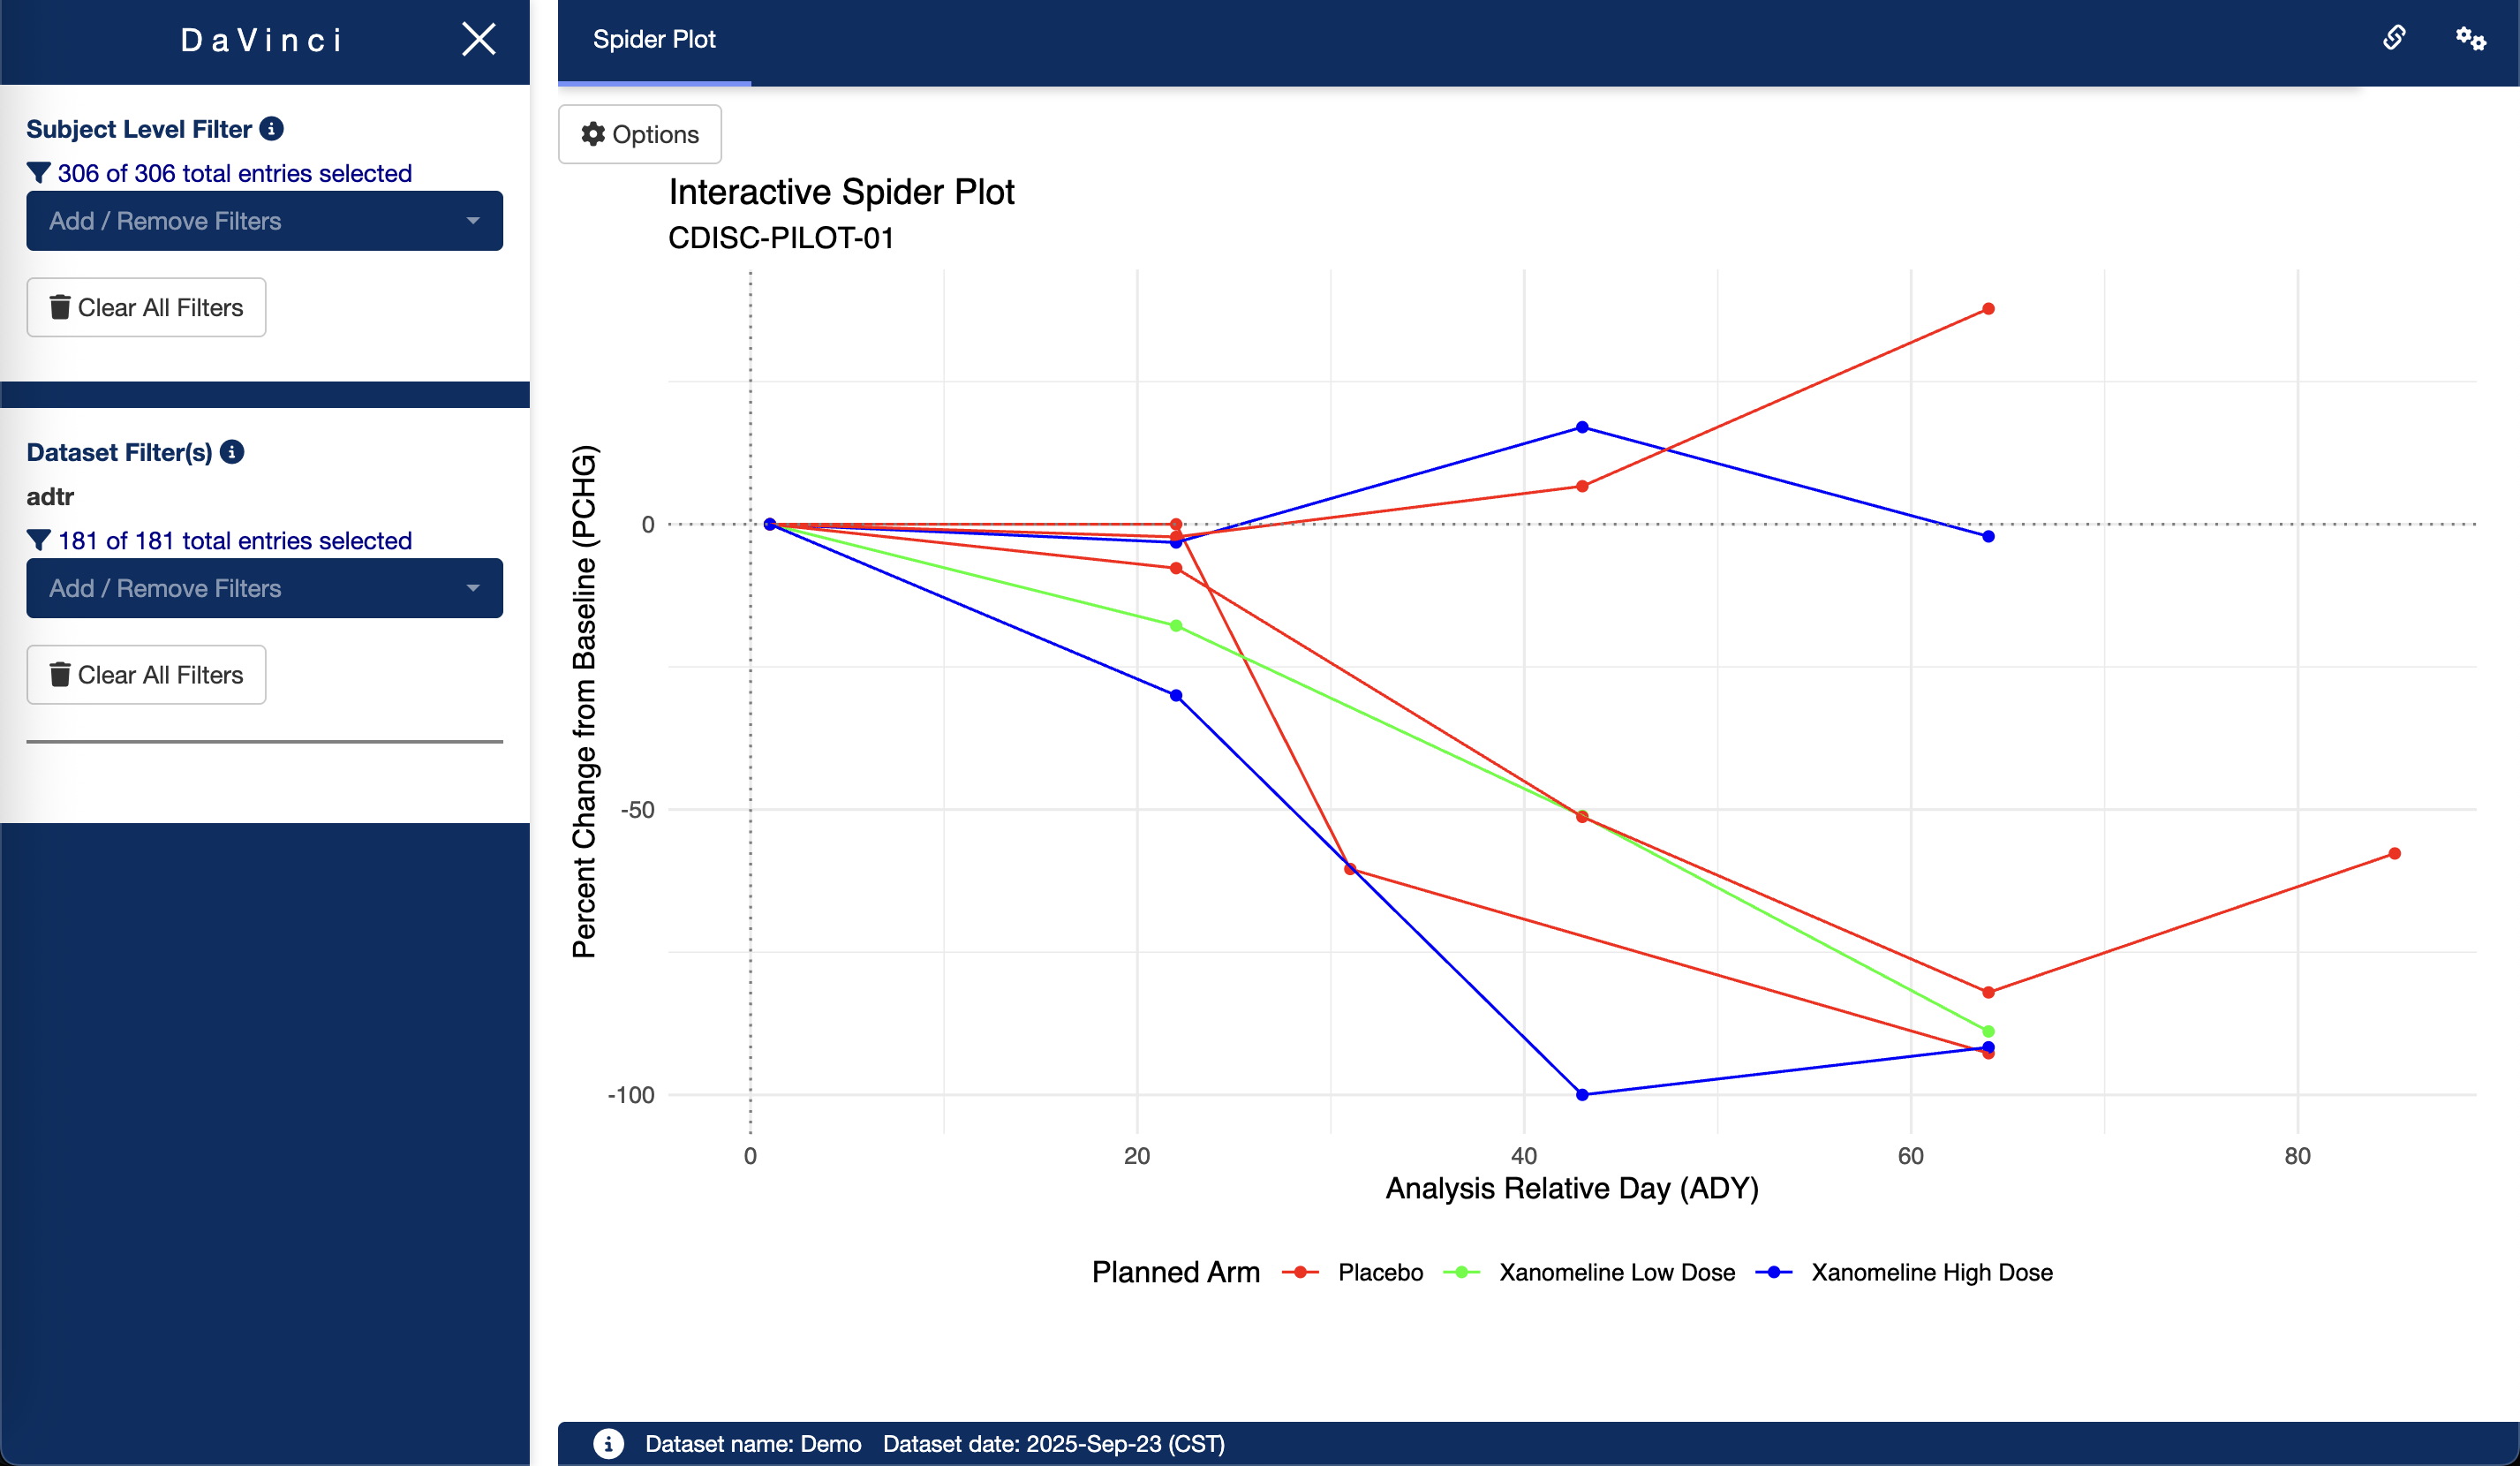
The Spiderplot module visualizes individual patient trajectories over time in clinical trials, particularly valuable for oncology efficacy analysis. Users can display patient-level response data as spider plots showing changes in tumor size or other clinical measurements across multiple visits, with scatter points at defined time units. Additional features include subgrouping entities by criteria on separate plots, supporting use cases like treatment efficacy comparisons and patient visit/lab indicator analyses. It supports drill-through to Patient Profile, allowing users to click a data point and open the corresponding subject in dv.papo.
Use case: Oncology Efficacy Monitoring
Swimmerplot by {dv.swimmerplot}
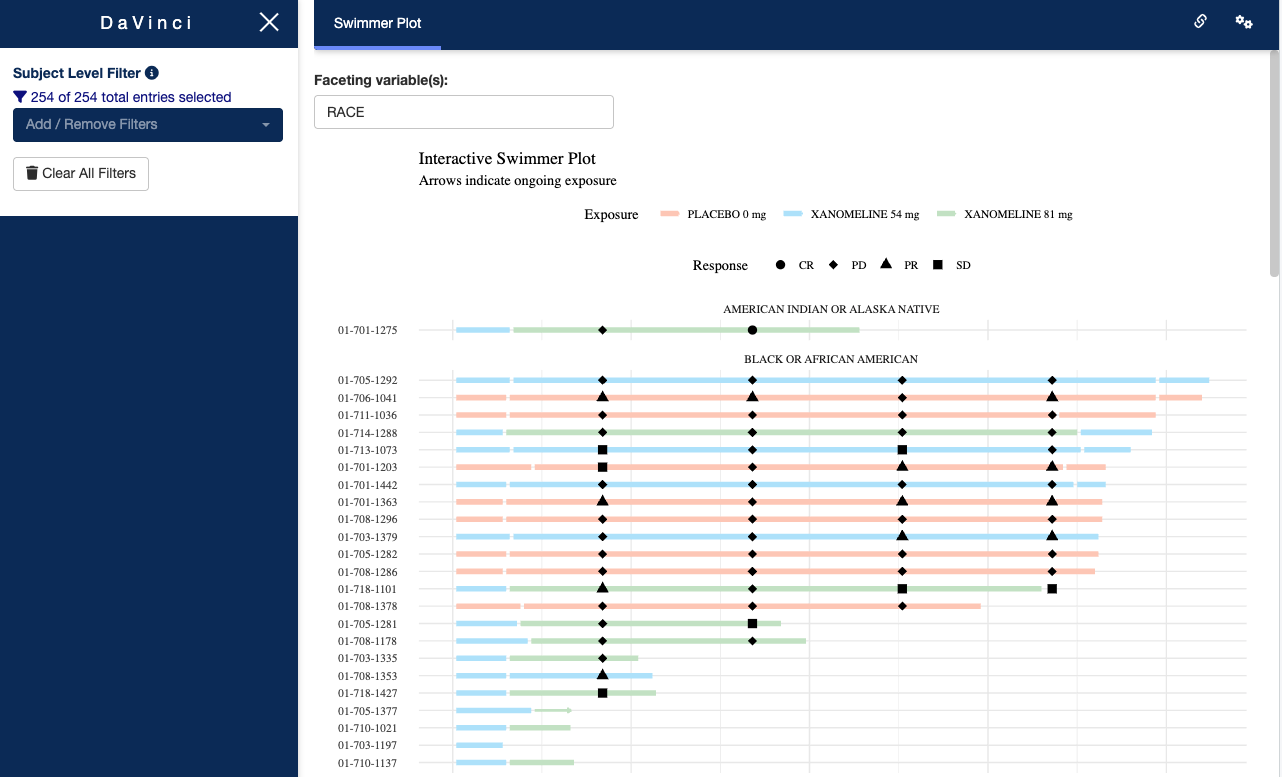
The Swimmerplot module enables users to create interactive swimmer plots for clinical trial data. Each patient is displayed as a horizontal swim lane showing their treatment timeline, with arrows indicating ongoing treatments and optional markers for clinical responses like tumor shrinkage or disease progression. Patients can be grouped and sorted by characteristics such as demographics or treatment type, with interactive features including hover tooltips and clickable navigation to detailed patient views.
Use case: Oncology Efficacy Monitoring
Tplyr table by {dv.tables}
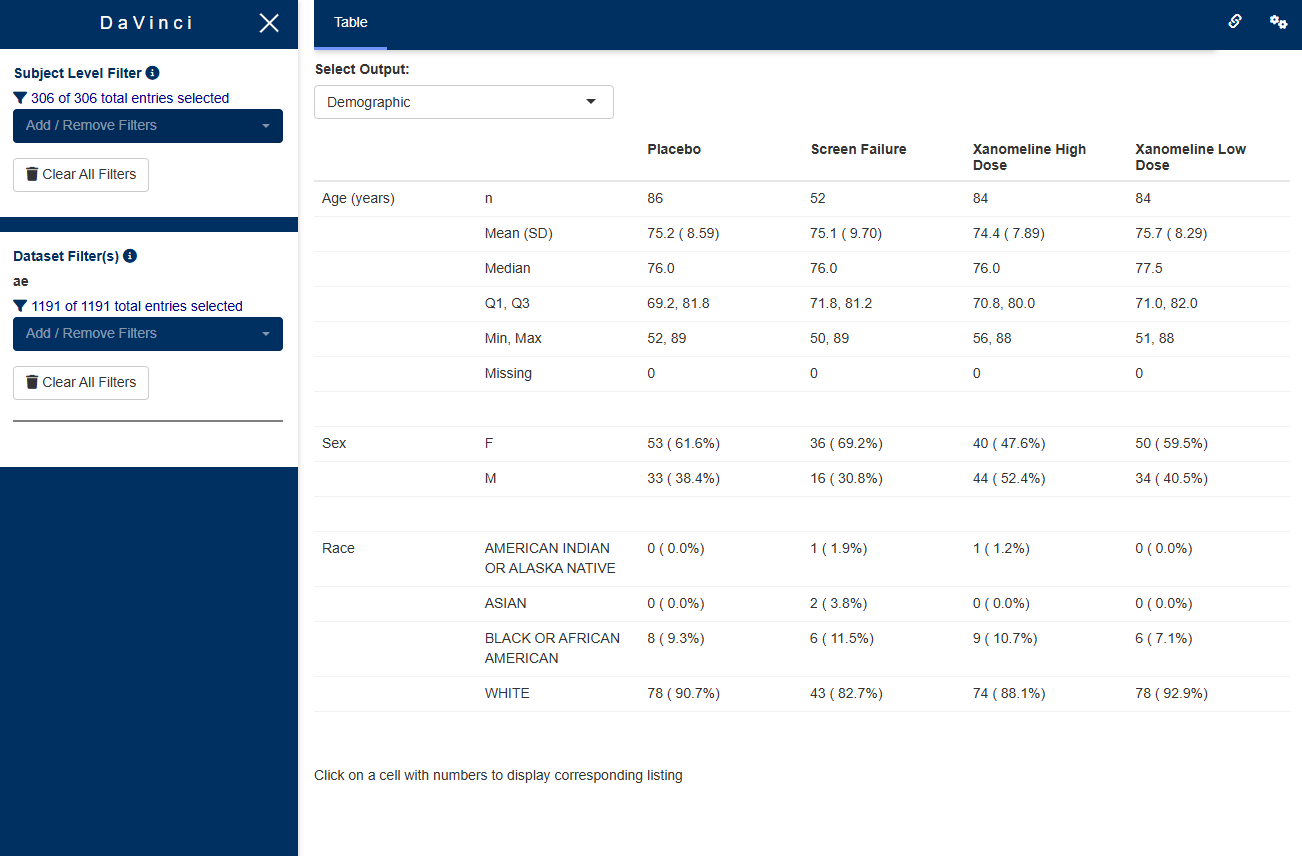
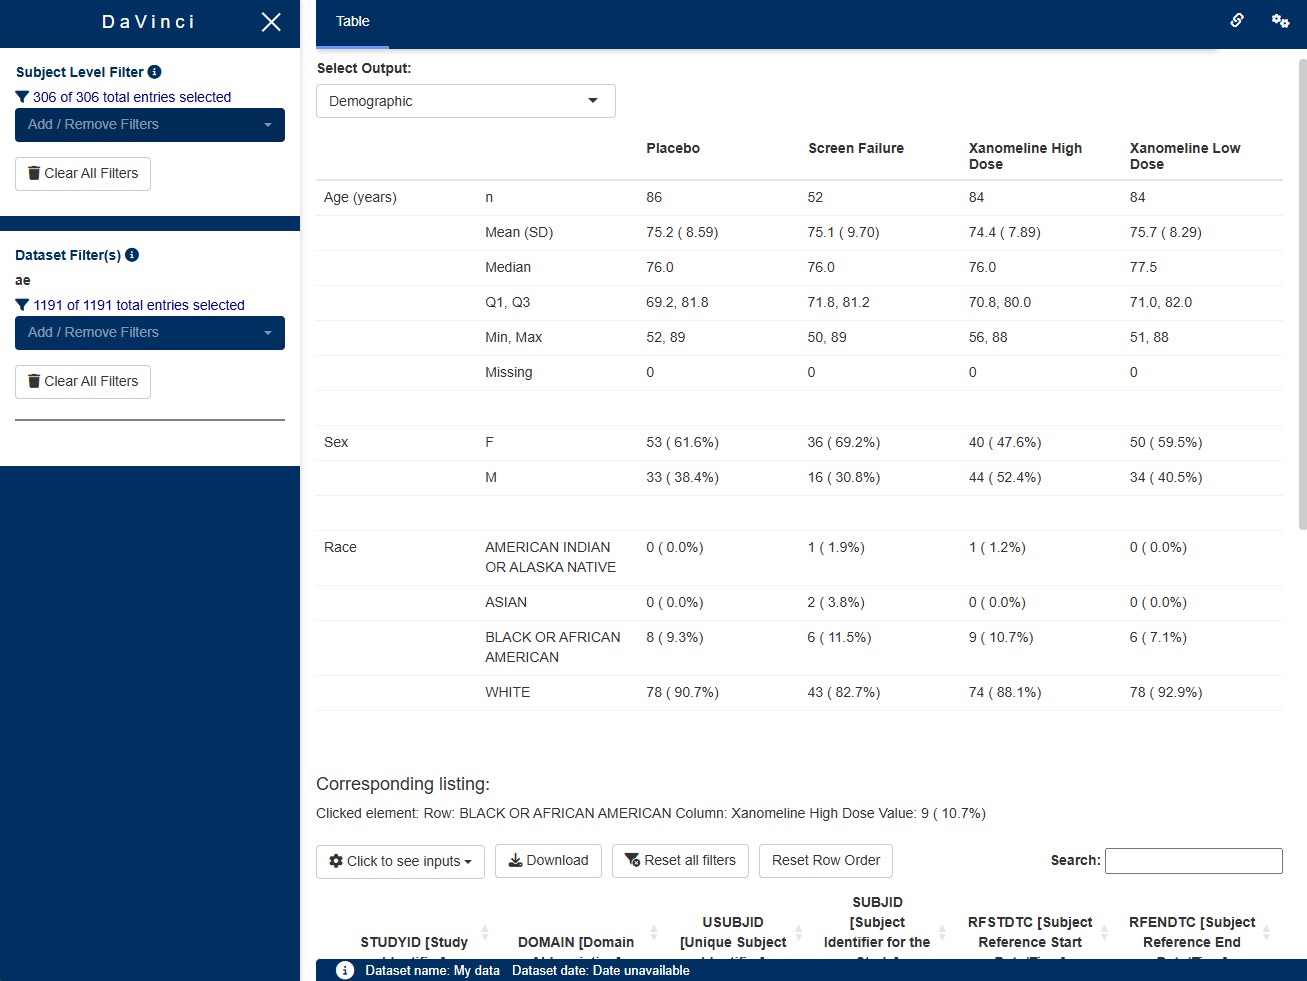
The Tplyr table module enables interactive visualization of summary tables created with {Tplyr} within DaVinci apps. It acts as a wrapper that not only displays these tables but also provides traceability by linking each result cell back to its source listing using {dv.listings}. The module supports multiple Tplyr tables and standalone listings under one tab via a drop-down selector, making it easier for app creators to build flexible, auditable, and user-friendly clinical data review apps.
Use case: Quality Monitoring
Waterfall plus heatmap by {dv.explorer.parameter}
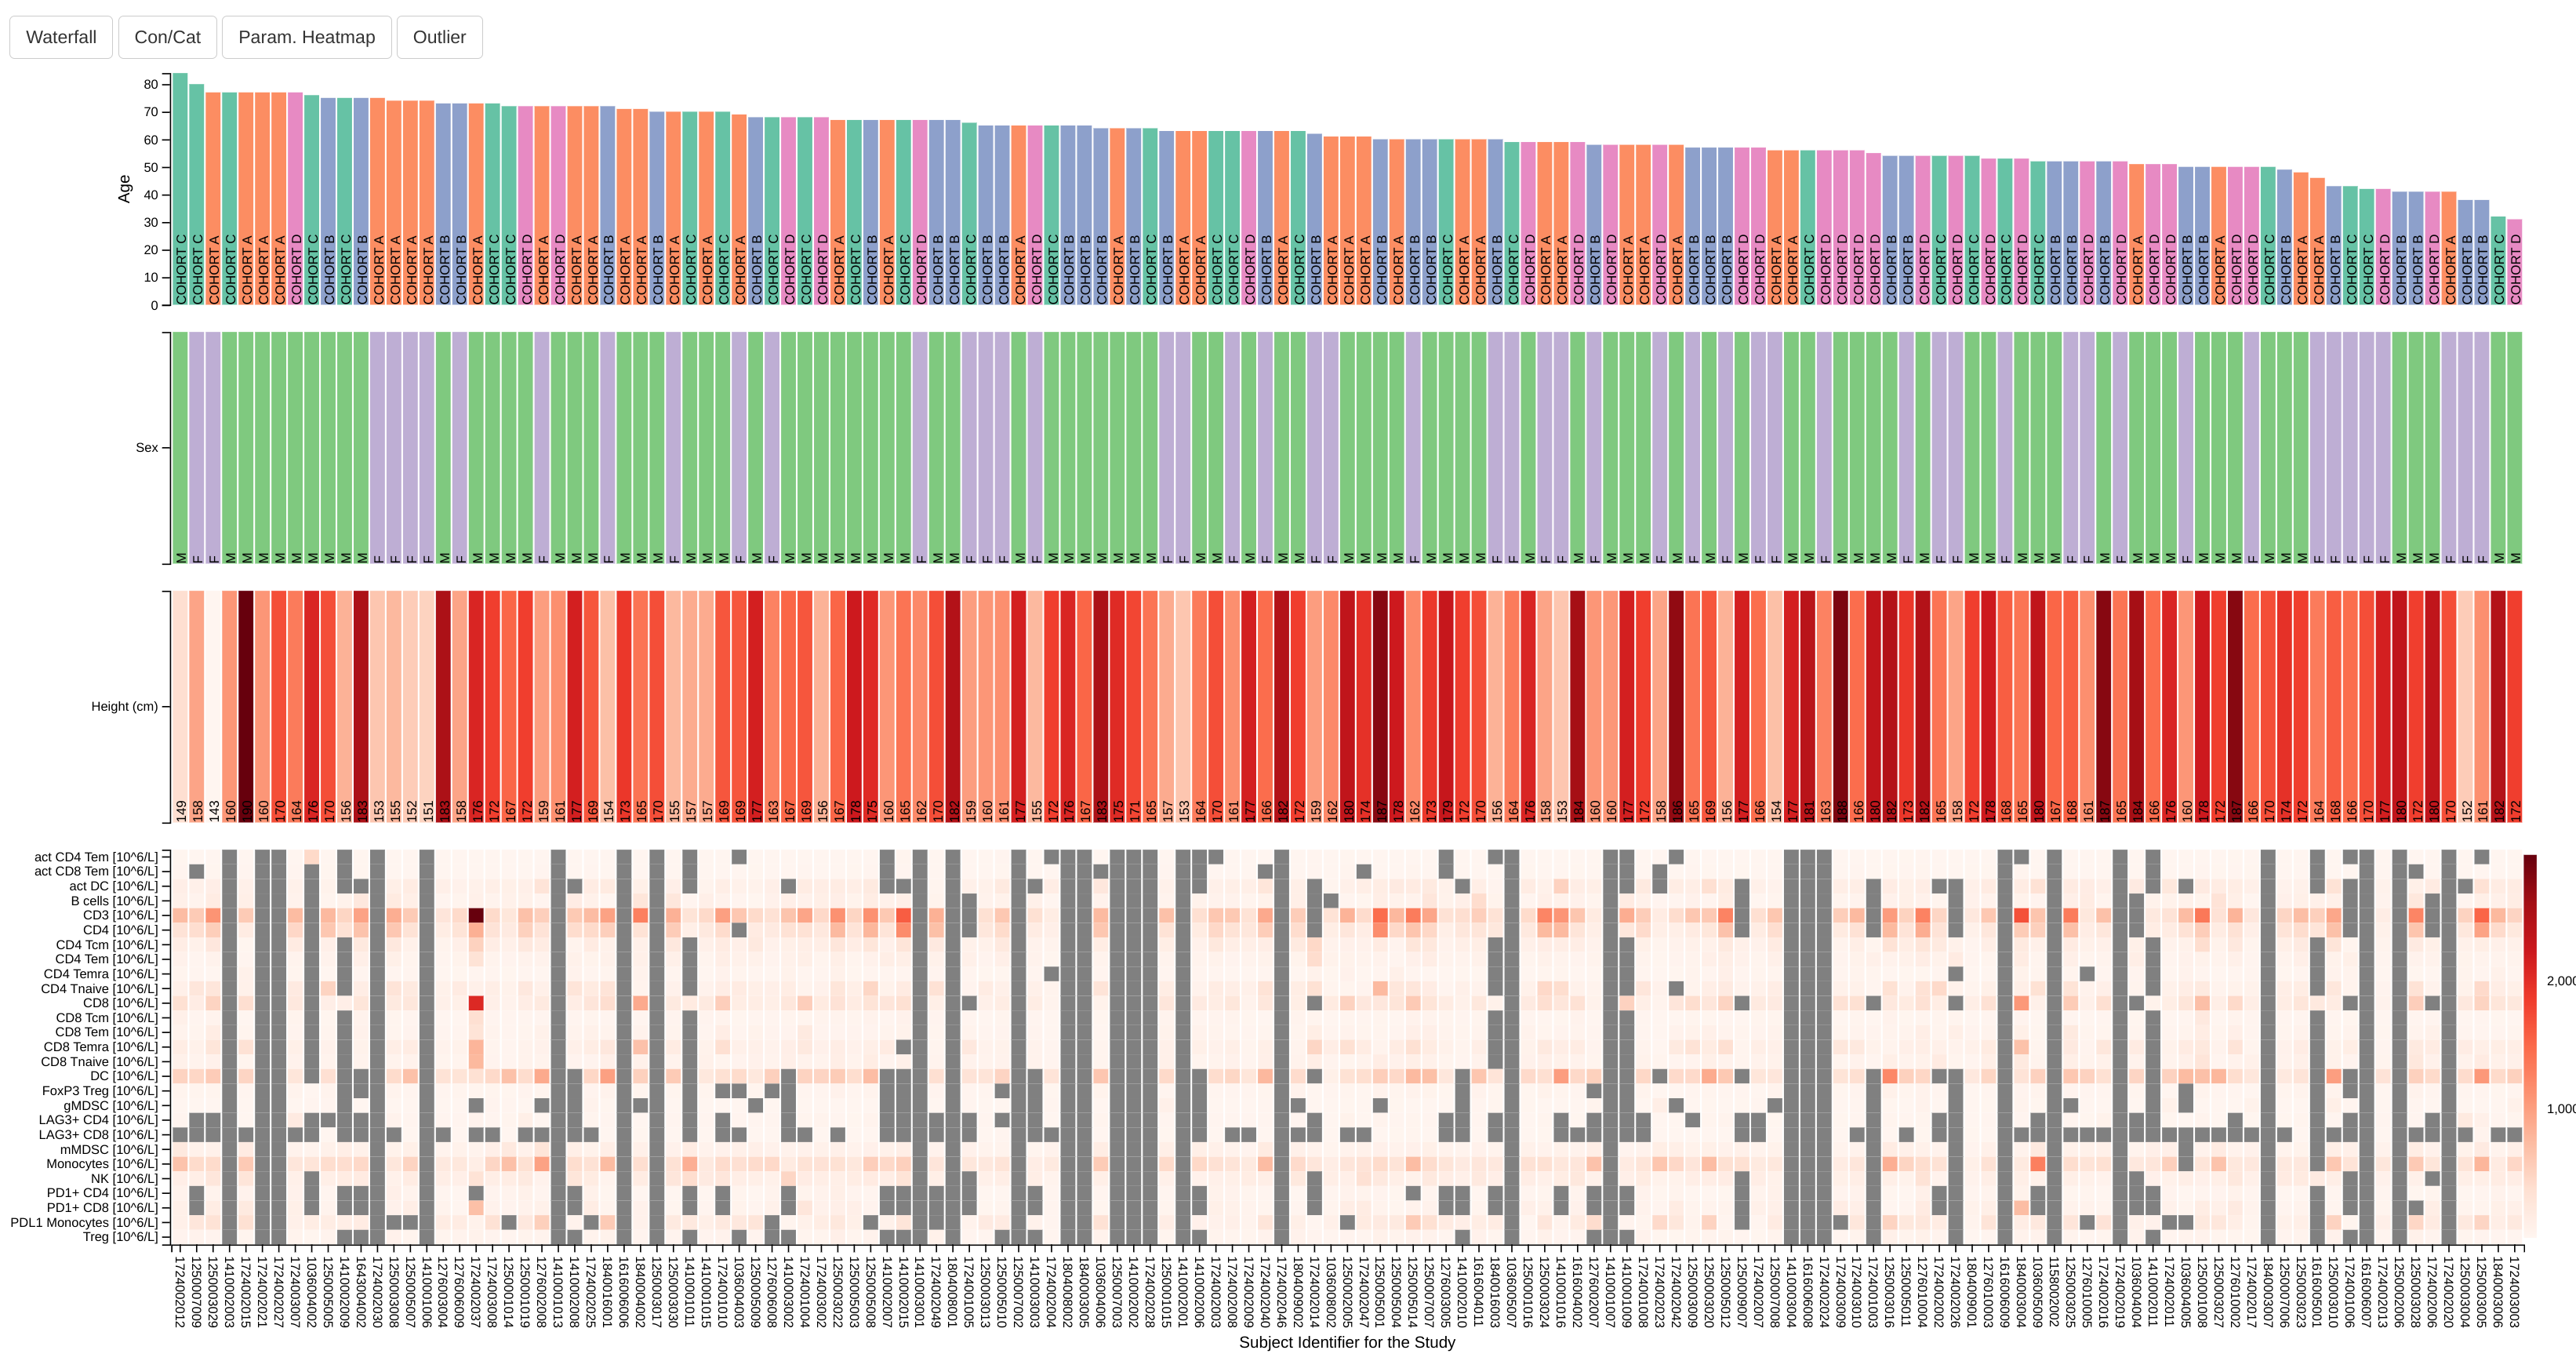
The Waterfall plus heatmap module package includes a waterfall plot and aligned categorical continuous and parameter heatmaps.
Use case: Biomarker Analysis, Parameter Exploration
Other useful packages
DaVinci’s Teal wrapper package by {dv.teal}
The dv.teal package provides a wrapper function to include Teal modules within the DaVinci framework.
Use case: Any