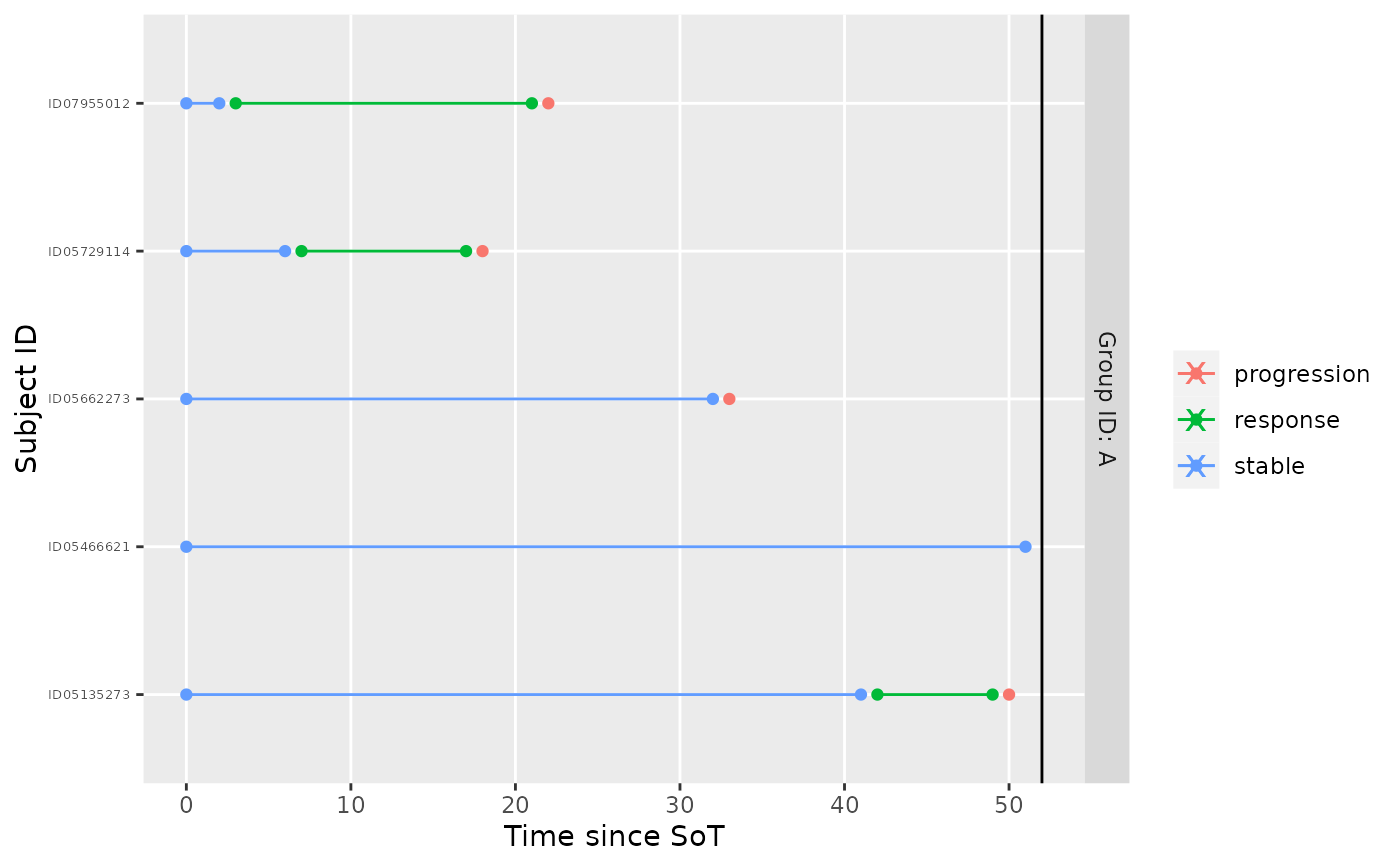
plot_mstate() plots data in 'multi-state-format' as swimmer plot.
Usage
plot_mstate(
  data,
  model,
  now = max(tbl_mstate$t_max),
  relative_to_sot = TRUE,
  ...
)
Arguments
- data
a data frame with multi-state data; variables are
subject_id<chr>,group_id<chr>,subject_id<chr>,from<chr>,to<chr>,t_min<dbl>,t_max<dbl>,t_sot<dbl>, wheretoandfromindicate the state from which and into which the transitions occurs (stable, response, progression),t_maxandt_minspecify the interval in which the transition occurred relative tot_sot(start of treatment).- model
an object of class srpmodel containing prior information
- now
the current time relative to the start of the trial
- relative_to_sot
logical, should the timeline be relative to the start of trial or the start of treatment for each individual
- ...
further arguments passed to method implementations
Value
a ggplot2::ggplot object
Examples
mdl <- create_srpmodel(A = define_srp_prior())
tbl_visits <- sample_predictive(mdl, n_per_group = 5L, nsim = 1, seed = 468L)
tbl_mstate <- visits_to_mstate(tbl_visits, mdl)
plot_mstate(tbl_mstate, mdl)