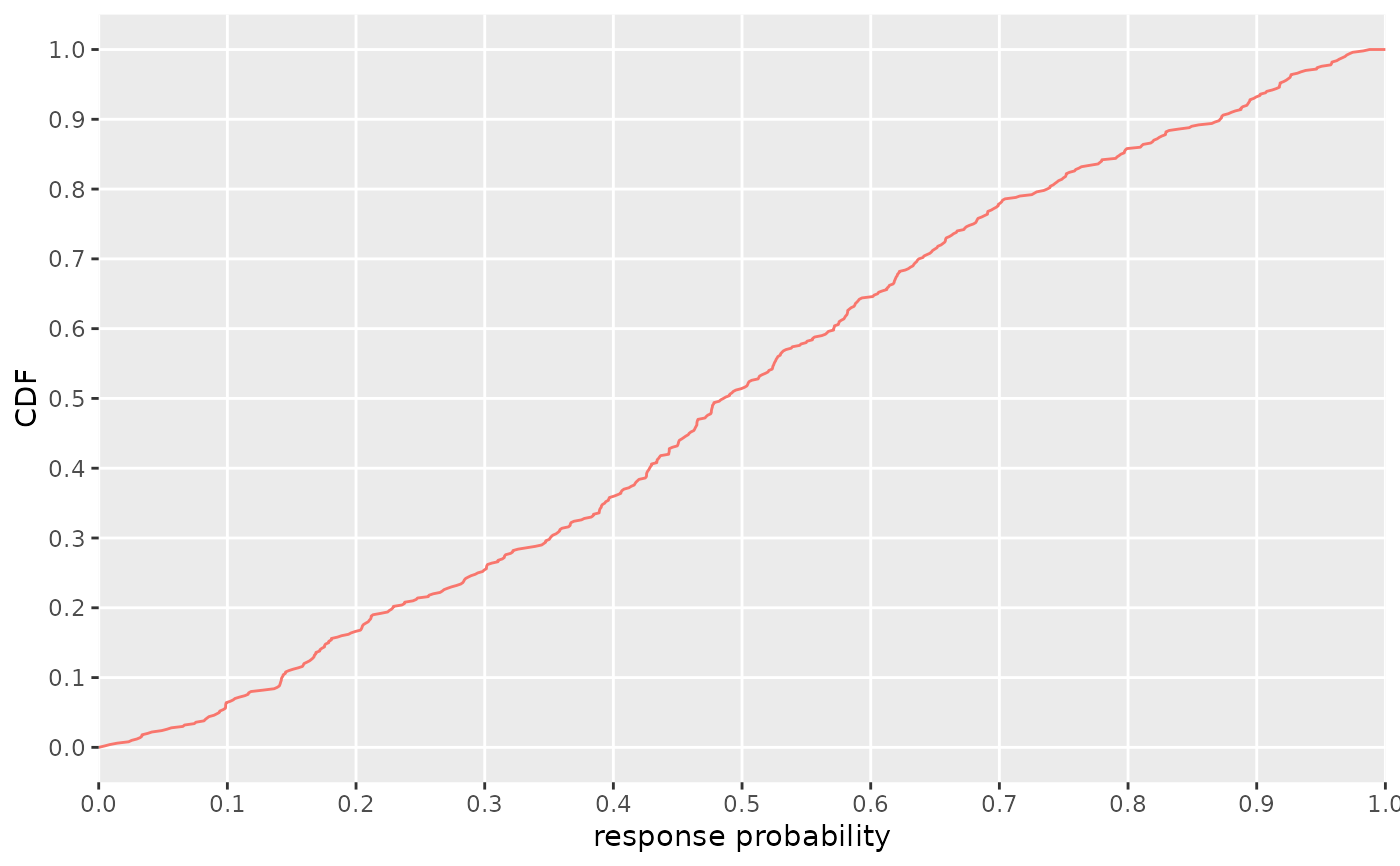
Plot the response probability distributions
Source:R/plot_response_probability.R
plot_response_probability.Rdplot_response_probability() plots the distribution over the response
probability parameter in the specified model.
Usage
plot_response_probability(
  model,
  parameter_sample = NULL,
  seed = 42L,
  nsim = 500L,
  warmup = 250,
  nuts_control = list(),
  ...
)
Arguments
- model
an object of class srpmodel containing prior information
- parameter_sample
a stanfit object with samples from the respective model.
- seed
integer, fixed random seed; NULL for no fixed seed
- nsim
integer, number of samples to draw
- warmup
integer, number of warm-up samples for the MCMC sampler before retaining samples; see
warmupparameter inrstan::stan().- nuts_control
list, parameters for NUTS algorithm see
controlargument inrstan::stan()- ...
further arguments passed to method implementations
Value
a ggplot2::ggplot object
Examples
mdl <- create_srpmodel(A = define_srp_prior())
plot_response_probability(mdl)