The eDISH module supports the assessment of drug-induced liver injury by means of the (modified) evaluation of Drug-Induced Serious Hepatotoxicity plot.
Installation
if (!require("remotes")) install.packages("remotes")
remotes::install_github("Boehringer-Ingelheim/dv.edish")
Features
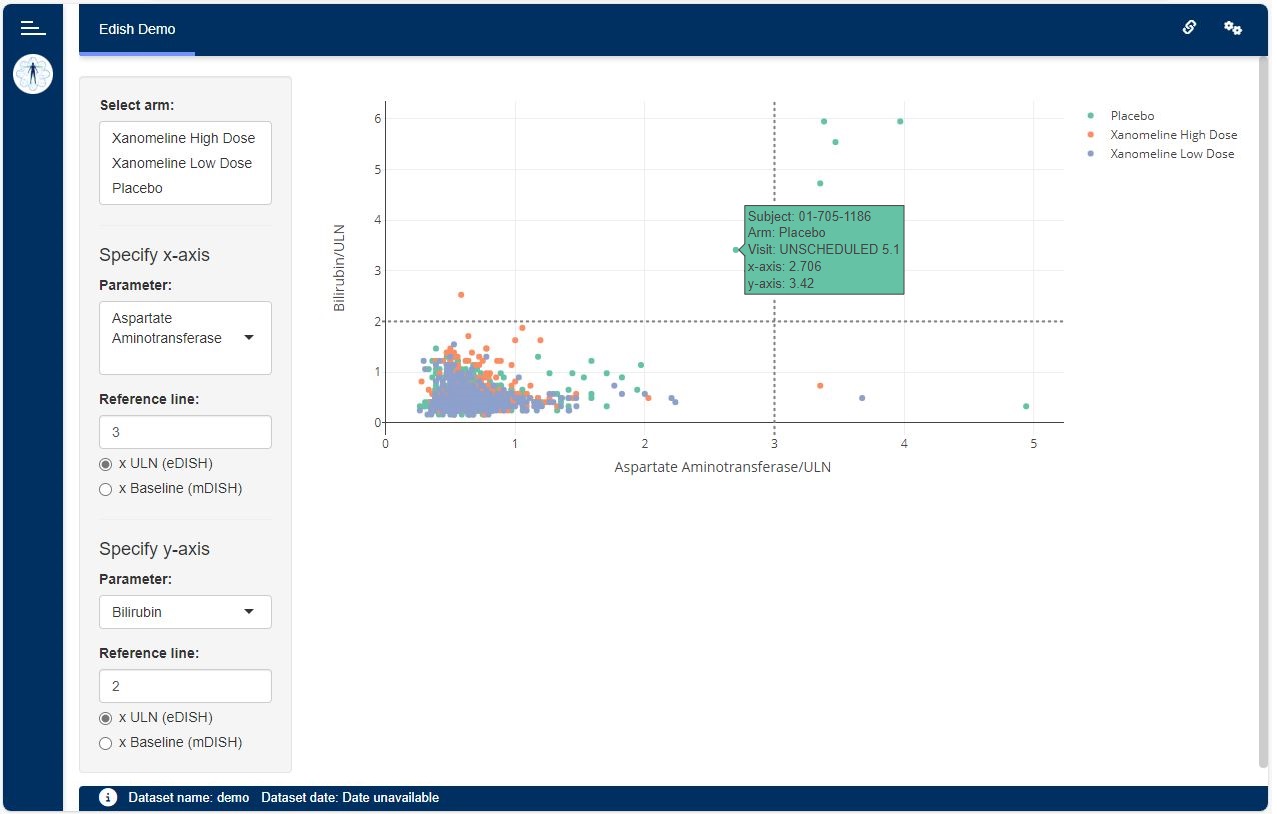
The eDISH module shows a scatter plot depicting the correlation between peak values of an aminotransferase parameter and a liver function parameter on a subject level.
The user can control the following from the user interface drop-down plot options:
- Treatment arm selection.
- The aminotransferase parameter to be displayed on the x-axis (e.g. Alanine Aminotransferase or Aspartate Aminotransferase).
- The liver function parameter to be displayed on the y-axis (e.g. Total Bilirubin or Prothrombin Intl. Normalized Ratio)
- The window in which the liver function parameter value is considered in relation to the aminotransferase value.
- Whether the parameters are displayed in multiples of either their upper limits of normal (resulting in the eDISH plot) or the corresponding subject’s baseline values (resulting in the mDISH plot).
- Horizontal and vertical reference lines indicating Hy’s law multiples.
- Whether to include subjects based on their baseline value being within the aminotransferase threshold.
- Whether to plot subject aminotransferase values by visit, with lines connecting points between visits.
- Lower and/or upper values of the x- and y-axis ranges. If not specified then these values are determined by the data.
When hovering over a point the following pop-up information is displayed:
- Subject identifier.
- Arm.
- Normalized aminotransferase peak value, visit, and date.
- Associated normalized Alkaline Phosphatase value categorized.
- R-ratio categorized.
- Normalized liver function parameter peak value, visit, and date.
- Time in days between aminotransferase and liver function dates. Negative days indicates that liver function date is before aminotransferase date.
Normalized Alkaline Phosphatase (ALP/ULN or ALP/Baseline) categories are shown as ≤ 2 or > 2.
The R-ratio (specific to ULN) is calculated as R = Normalized aminotransferase / Normalized ALP:
- R ≥ 5 Hepatocellular - aminotransferase dominates; typical for Hy’s Law
- R ≤ 2 Cholestatic - ALP dominates
- 2 < R < 5 Mixed - Both aminotransferase and ALP elevated
Creating an eDISH application
The following example shows how to set up a simple DaVinci app by means of {dv.manager}. The app contains the eDISH module to display dummy data provided by the {pharmaverseadam} package:
dm <- pharmaverseadam::adsl
lb <- pharmaverseadam::adlb

module_list <- list(
  "edish" = dv.edish::mod_edish(
    module_id = "edish",
    subject_level_dataset_name = "dm",
    lab_dataset_name = "lb",
    lb_date_var = "ADT",
    arm_default_vals = c("Xanomeline Low Dose", "Xanomeline High Dose"),
    baseline_visit_val = "SCREENING 1"
  )
)

dv.manager::run_app(
  data = list("demo" = list("dm" = dm, "lb" = lb)),
  module_list = module_list,
  filter_data = "dm"
)
Note that the module expects two datasets:
-
A Demographics dataset (e.g.
dmoradsl) including, at least, variables containing the following information:Unique subject identifier (e.g.
USUBJID)Arm (e.g.
ACTARM)
-
A Laboratory Test Results dataset (e.g.
lboradlb) including, at least, variables containing the following information:Unique subject identifier (e.g.
USUBJID)Visit (e.g.
VISIT)Lab test result name (e.g.
LBTEST)Lab test date (e.g.
ADT)Numeric lab test result (e.g.
LBSTRESN)Lab test reference range upper limit (e.g.
LBSTNRHI)