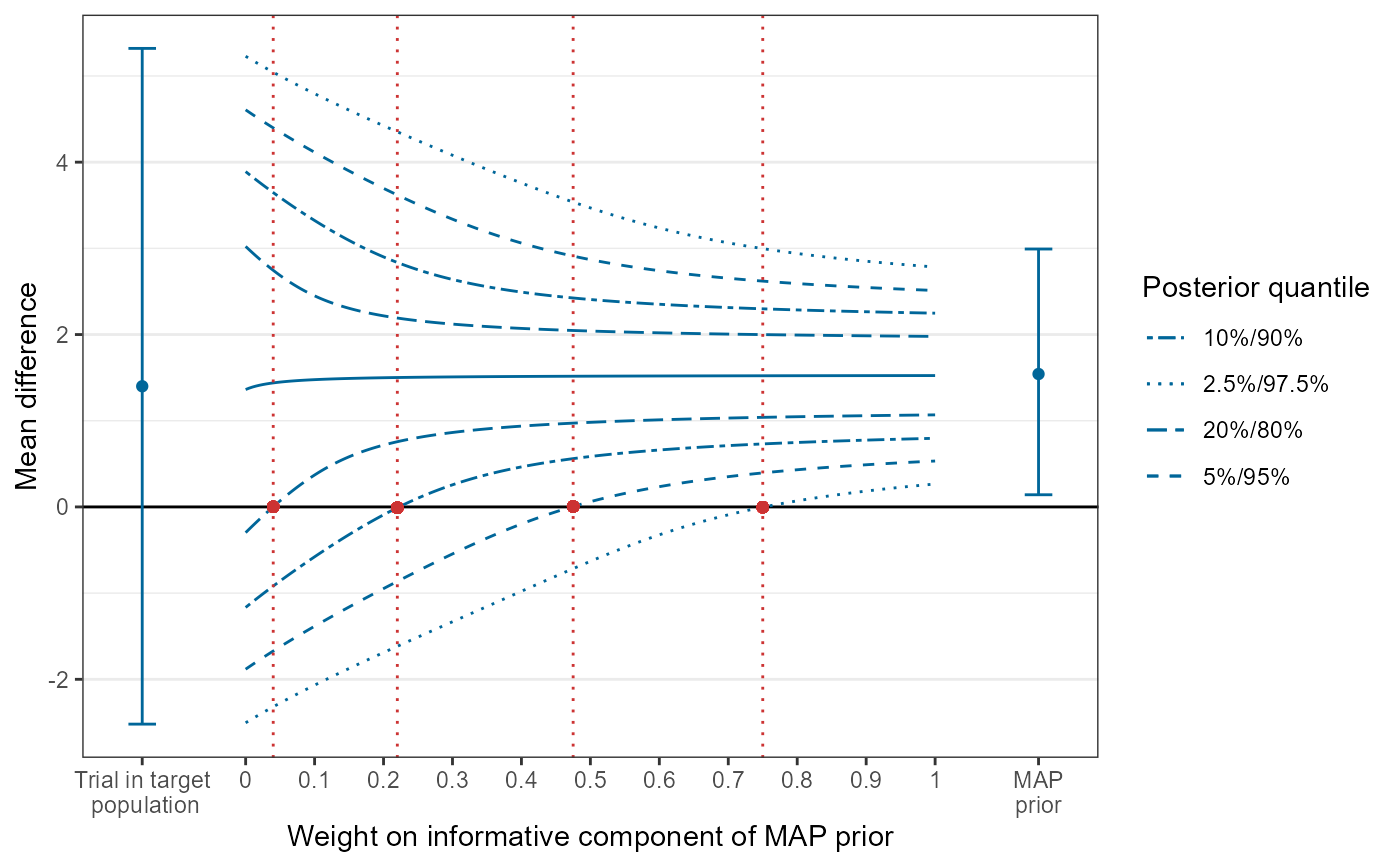
Uses a data frame created by create_tipmap_data() to visualize the tipping point analysis.
Usage
tipmap_plot(
  tipmap_data,
  target_pop_lab = "Trial in target\n population",
  y_range = NULL,
  y_breaks = NULL,
  title = NULL,
  y_lab = "Mean difference",
  x_lab = "Weight on informative component of robust MAP prior",
  map_prior_lab = "MAP\nprior",
  meta_analysis_lab = "MA",
  legend_title = "Posterior quantile",
  null_effect = 0
)
Arguments
- tipmap_data
A data frame containing tipping point data, generated by [create_tipmap_data()].
- target_pop_lab
A label for the trial in the target population.
- y_range
An optional argument specifying range of the y-axis.
- y_breaks
An optional vector specifying breaks on the y-axis.
- title
The plot title.
- y_lab
The label for the y axis. Defaults to "Mean difference".
- x_lab
The label for the x axis. Defaults to "Weight on informative component of MAP prior".
- map_prior_lab
The label for the MAP prior. Defaults to "MAP prior"
- meta_analysis_lab
An optional label for a meta-analysis (if included).
- legend_title
An optional title for the plot legend. Defaults to "Posterior quantiles".
- null_effect
The null treatment effect, determining where tipping points are calculated. Defaults to 0.
Examples
tipmap_data <- load_tipmap_data("tipdat.rds")
tipmap_plot(tipmap_data)
#> Warning: All aesthetics have length 1, but the data has 201 rows.
#> ℹ Did you mean to use `annotate()`?
#> Warning: All aesthetics have length 1, but the data has 201 rows.
#> ℹ Did you mean to use `annotate()`?
#> Warning: All aesthetics have length 1, but the data has 201 rows.
#> ℹ Did you mean to use `annotate()`?
#> Warning: All aesthetics have length 1, but the data has 201 rows.
#> ℹ Did you mean to use `annotate()`?

