Event Count module
hierarchical_count_table.Rmd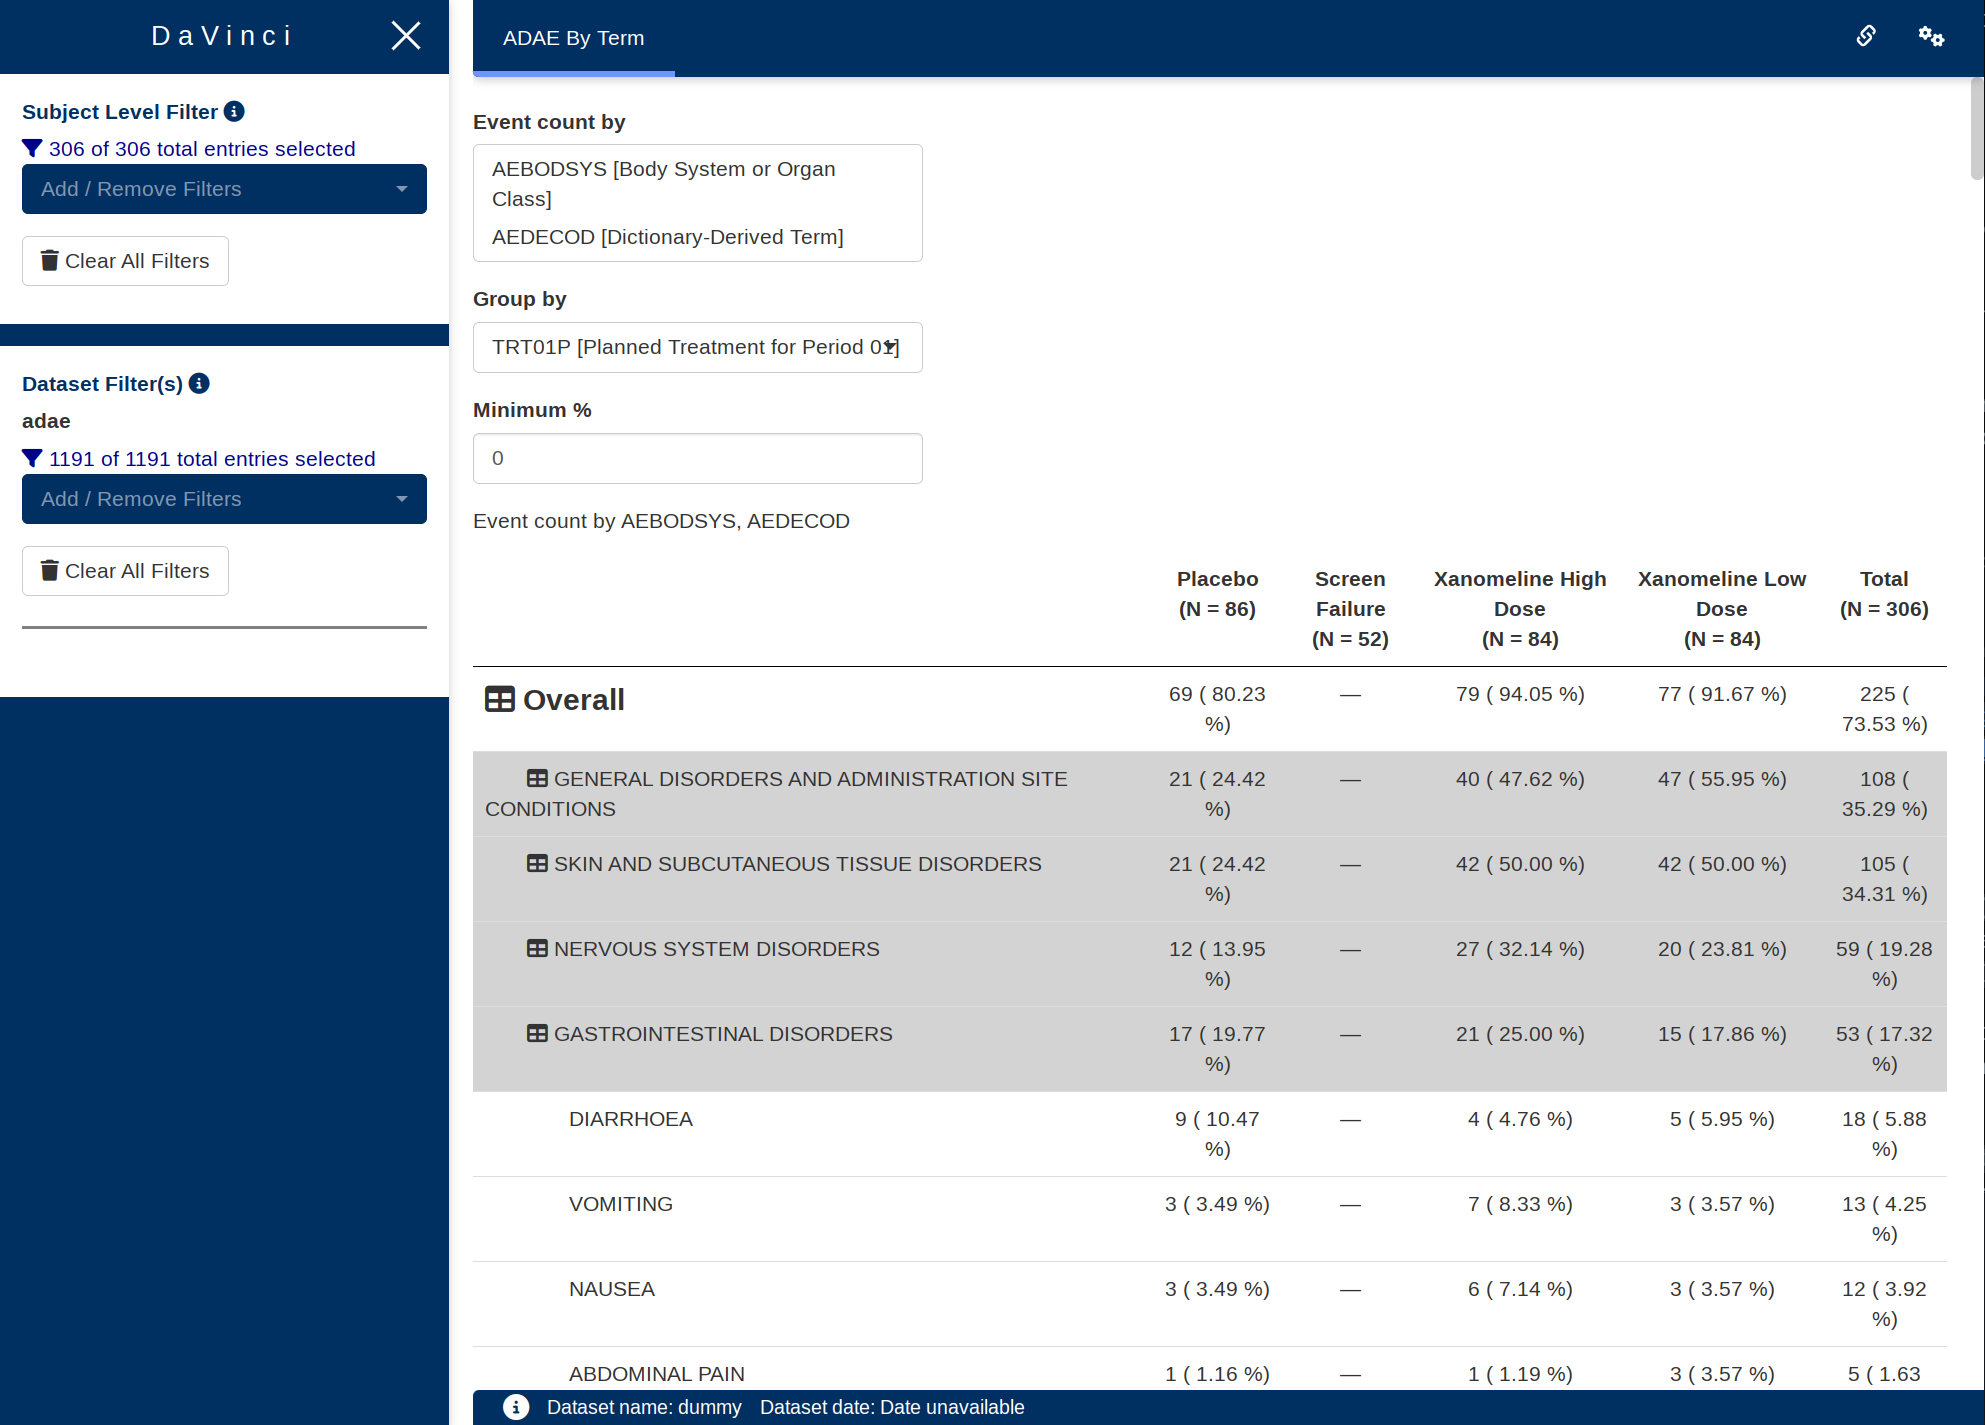
This guide provides a detailed overview of the
hierarchical_count_table module and its features. It is
meant to provide guidance to App Creators on creating Apps in DaVinci
using the hierarchical_count_table module. Walk-throughs
for sample app creation using the module are also included to
demonstrate the various module specific features.
The hierarchical_count_table module makes it possible to
visualize a hierarchy table with event counts for each of the levels,
with the option of showing time at risk and incidence rates.
Features
- One or two levels of hierarchy, and a top-level summary of subjects with any event.
- Second level of hierarchy can be collapsed to only show the first level.
- First level of hierarchy can be collapsed to only show the subjects with any event.
- Grouping with group population size (N) displayed across columns of the table, with an optional “Total” column.
- Optionally apply sub-grouping by a variable from the events data (e.g. event severity).
- Event counts and percentages are displayed, and optionally time at risk and incidence rates can be displayed.
- Events within the hierarchy ordered by descending event count (totalled across all groups).
- Tables can be downloaded as Excel (.xlsx) or Word (.rtf).
- It supports bookmarking.
Arguments for the module
dv.tables::mod_hierarchical_count_table() module uses
several arguments with the following being mandatory and the rest
optional. As part of app creation, the app creator should specify the
values for these arguments as applicable.
Mandatory Arguments
module_id: A unique identifier of type character for the module in the app.subjid_var: A common column across all datasets that uniquely identify subjects. By default: “SUBJID”table_dataset_name: The dataset that contains the events per row. For example,ADAEpop_dataset_name: The dataset that contains one row per subject in the total population. For example,ADSLIt expects a one-record-per-subject dataset at least containingsubjid_var, with a structure similar to https://www.cdisc.org/kb/examples/adam-subject-level-analysis-adsl-dataset-80283806
Refer to dv.tables::mod_hierarchical_count_table() for
the complete list of arguments and their description.
Input menus
A drop-down “Options” menu provides the following inputs:
-
Event count by: Selection of one or two levels of
hierarchy variables from the table (events) dataset, to be displayed
down the left side of the table, e.g.
AEBODSYS,AEDECOD. -
Group by: Selection of a grouping variable from the
subject-level population dataset, to be displayed across the top of the
table, e.g.
TRT01P. -
Minimum %: The minimum percentage threshold for
filtering events. Rows where the percentage of subjects (totalled across
all group categories) is below this threshold will be removed from the
output. Defaults to
0. - Total: Checkbox that controls whether or not to display a “Total” column totalling data from all group categories.
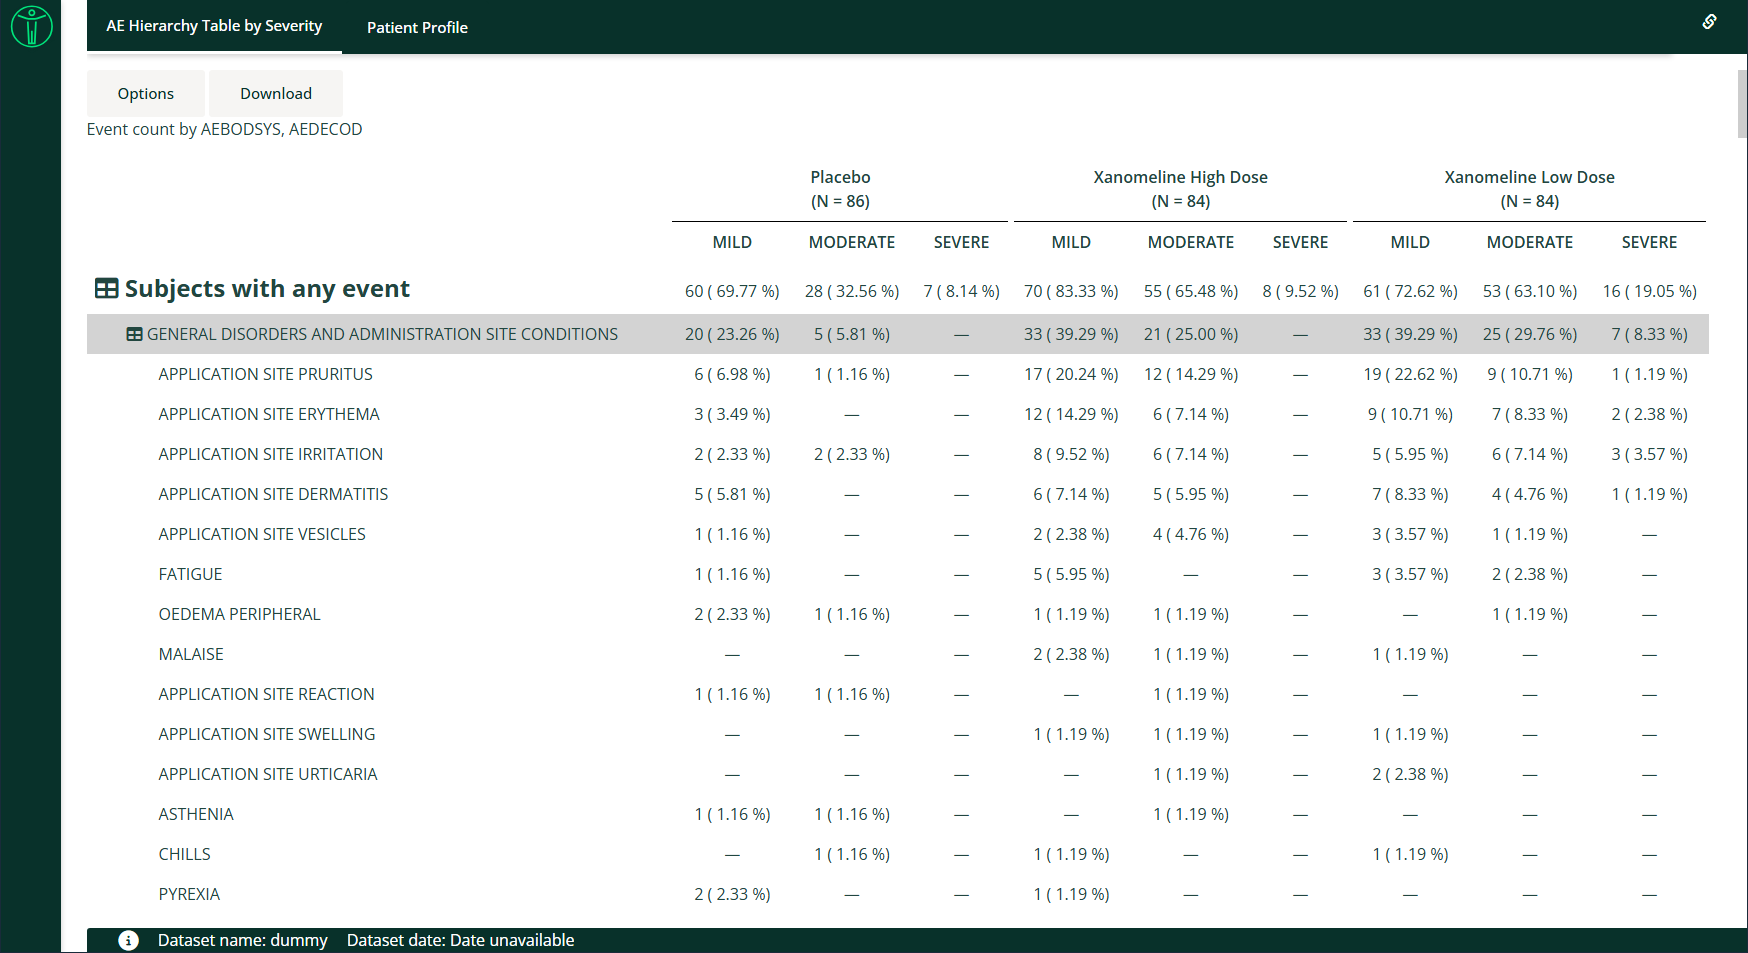
The following input will also be available in the “Options” menu when
the show_event_group_by module argument is set to
TRUE:
-
Event group by: Selection of a sub-grouping
variable from the table (events) dataset, to be displayed across the top
of the table under the main grouping, e.g.
AESEV.
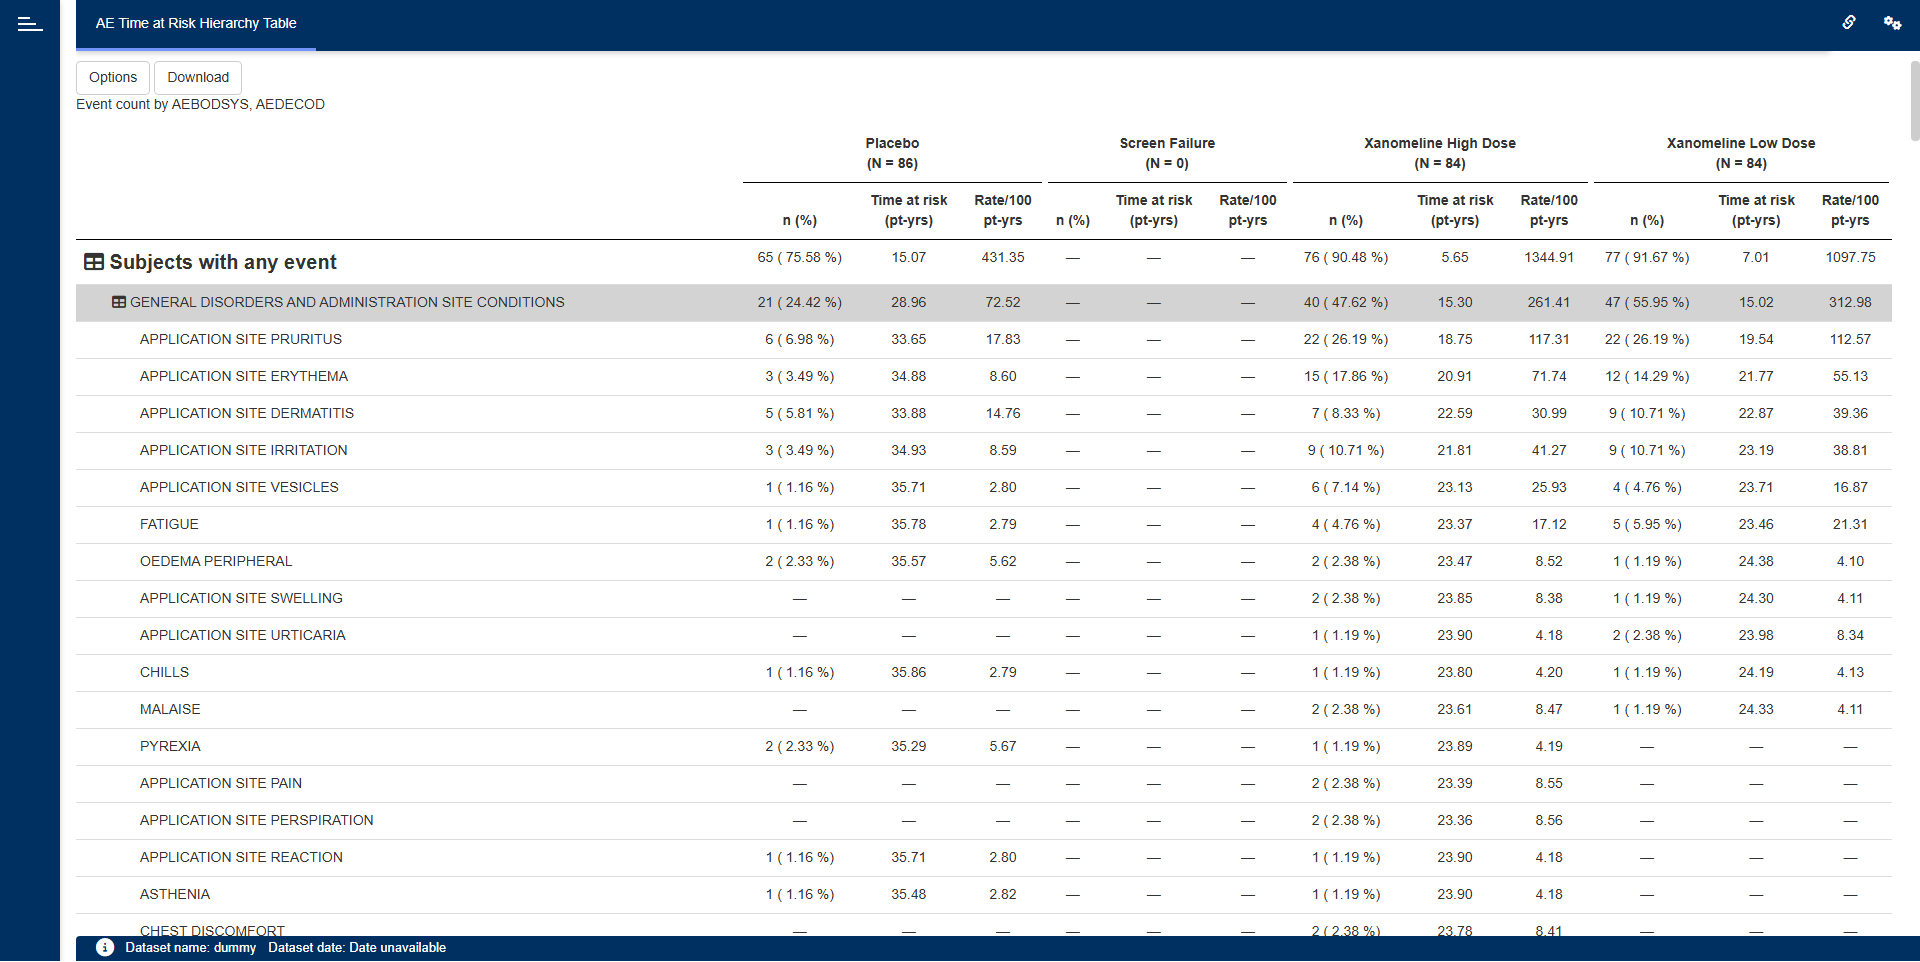
The following inputs will also be available in the “Options” menu
when the show_time_at_risk_options module argument is set
to TRUE:
-
Event Date: A “Date” class
(e.g.
ASTDT) from the table events dataset. Events with missing dates will be excluded from the analysis. -
Origin Date: A “Date” class
(e.g.
RANDDT) from the subject-level population dataset. Events occurring before origin date will be excluded from the analysis. -
Censor Date: A “Date” class
(e.g.
EOSDT) from the subject-level population dataset. Events occurring after censor date will be excluded from the analysis. - Time at Risk: Checkbox that controls whether or not to display time at risk and incidence rate columns. If a subject has a missing origin or censor date, time at risk cannot be calculated and the subject will be excluded from the population count. Note that even if the checkbox is unchecked, events will still be selected based on event, origin and censor dates, but population count will not be affected.
Note that if event group-by has been specified
(show_event_group_by module argument set to TRUE) then
time-at-risk options are not available.
Creating a hierarchical count table application
The following code specifies the bare minimum module arguments with no default hierarchy or group specified:
requireNamespace("pharmaverseadam")

dv.manager::run_app(
  data = list(dummy = list(adsl = pharmaverseadam::adsl,
                           adae = pharmaverseadam::adae)),
  module_list = list(
    "AE Hierarchy Table" = dv.tables::mod_hierarchical_count_table(
      module_id = "hierarchical_count_table",
      table_dataset_name = "adae",
      pop_dataset_name = "adsl"
    )
  ),
  filter_data = "adsl",
  filter_key = "USUBJID"
)
The following code specifies module arguments for the display of a body system and preferred term hierarchy grouped by planned treatment group, and event severity:
requireNamespace("pharmaverseadam")

dv.manager::run_app(
  data = list(dummy = list(adsl = pharmaverseadam::adsl,
                           adae = pharmaverseadam::adae)),
  module_list = list(
    "AE Hierarchy Table by Severity" = dv.tables::mod_hierarchical_count_table(
      module_id = "hierarchical_count_table",
      table_dataset_name = "adae",
      pop_dataset_name = "adsl",
      show_event_group_by = TRUE,
      default_hierarchy = c("AEBODSYS", "AEDECOD"),
      default_group = "TRT01P",
      default_event_group = "AESEV",
      default_total = FALSE,
      event_group_choices = c("AESEV", "AETOXGR")
    )
  ),
  filter_data = "adsl",
  filter_key = "USUBJID"
)
The following code specifies module arguments for the display of a body system and preferred term hierarchy and planned treatment group, with date variables specified for time at risk and incidence rate analysis:
requireNamespace("pharmaverseadam")

dv.manager::run_app(
  data = list(dummy = list(adsl = pharmaverseadam::adsl,
                           adae = pharmaverseadam::adae)),
  module_list = list(
    "AE Time at Risk Hierarchy Table" = dv.tables::mod_hierarchical_count_table(
      module_id = "hierarchical_count_table",
      table_dataset_name = "adae",
      pop_dataset_name = "adsl",
      show_time_at_risk_options = TRUE,
      default_hierarchy = c("AEBODSYS", "AEDECOD"),
      default_group = "TRT01P",
      default_event_date = "ASTDT",
      default_origin_date = "TRTSDT",
      default_censor_date = "EOSDT",
      default_total = FALSE,
      default_risk = TRUE
    )
  ),
  filter_data = "adsl",
  filter_key = "USUBJID"
)
Download
This module allows downloading the table as Excel (.xlsx) or Word (.rtf).
In the downloaded table, overall number of patients (N =
seen in the selected group’s column header) is shown in the first row
below the column names.
Additionally, if the option to split count and percent into separate
columns is selected, then selected group variable’s metrics is split
into two columns for every group item, {group item} [N] to
show count value and {group item} [%] to show relative
percentage.