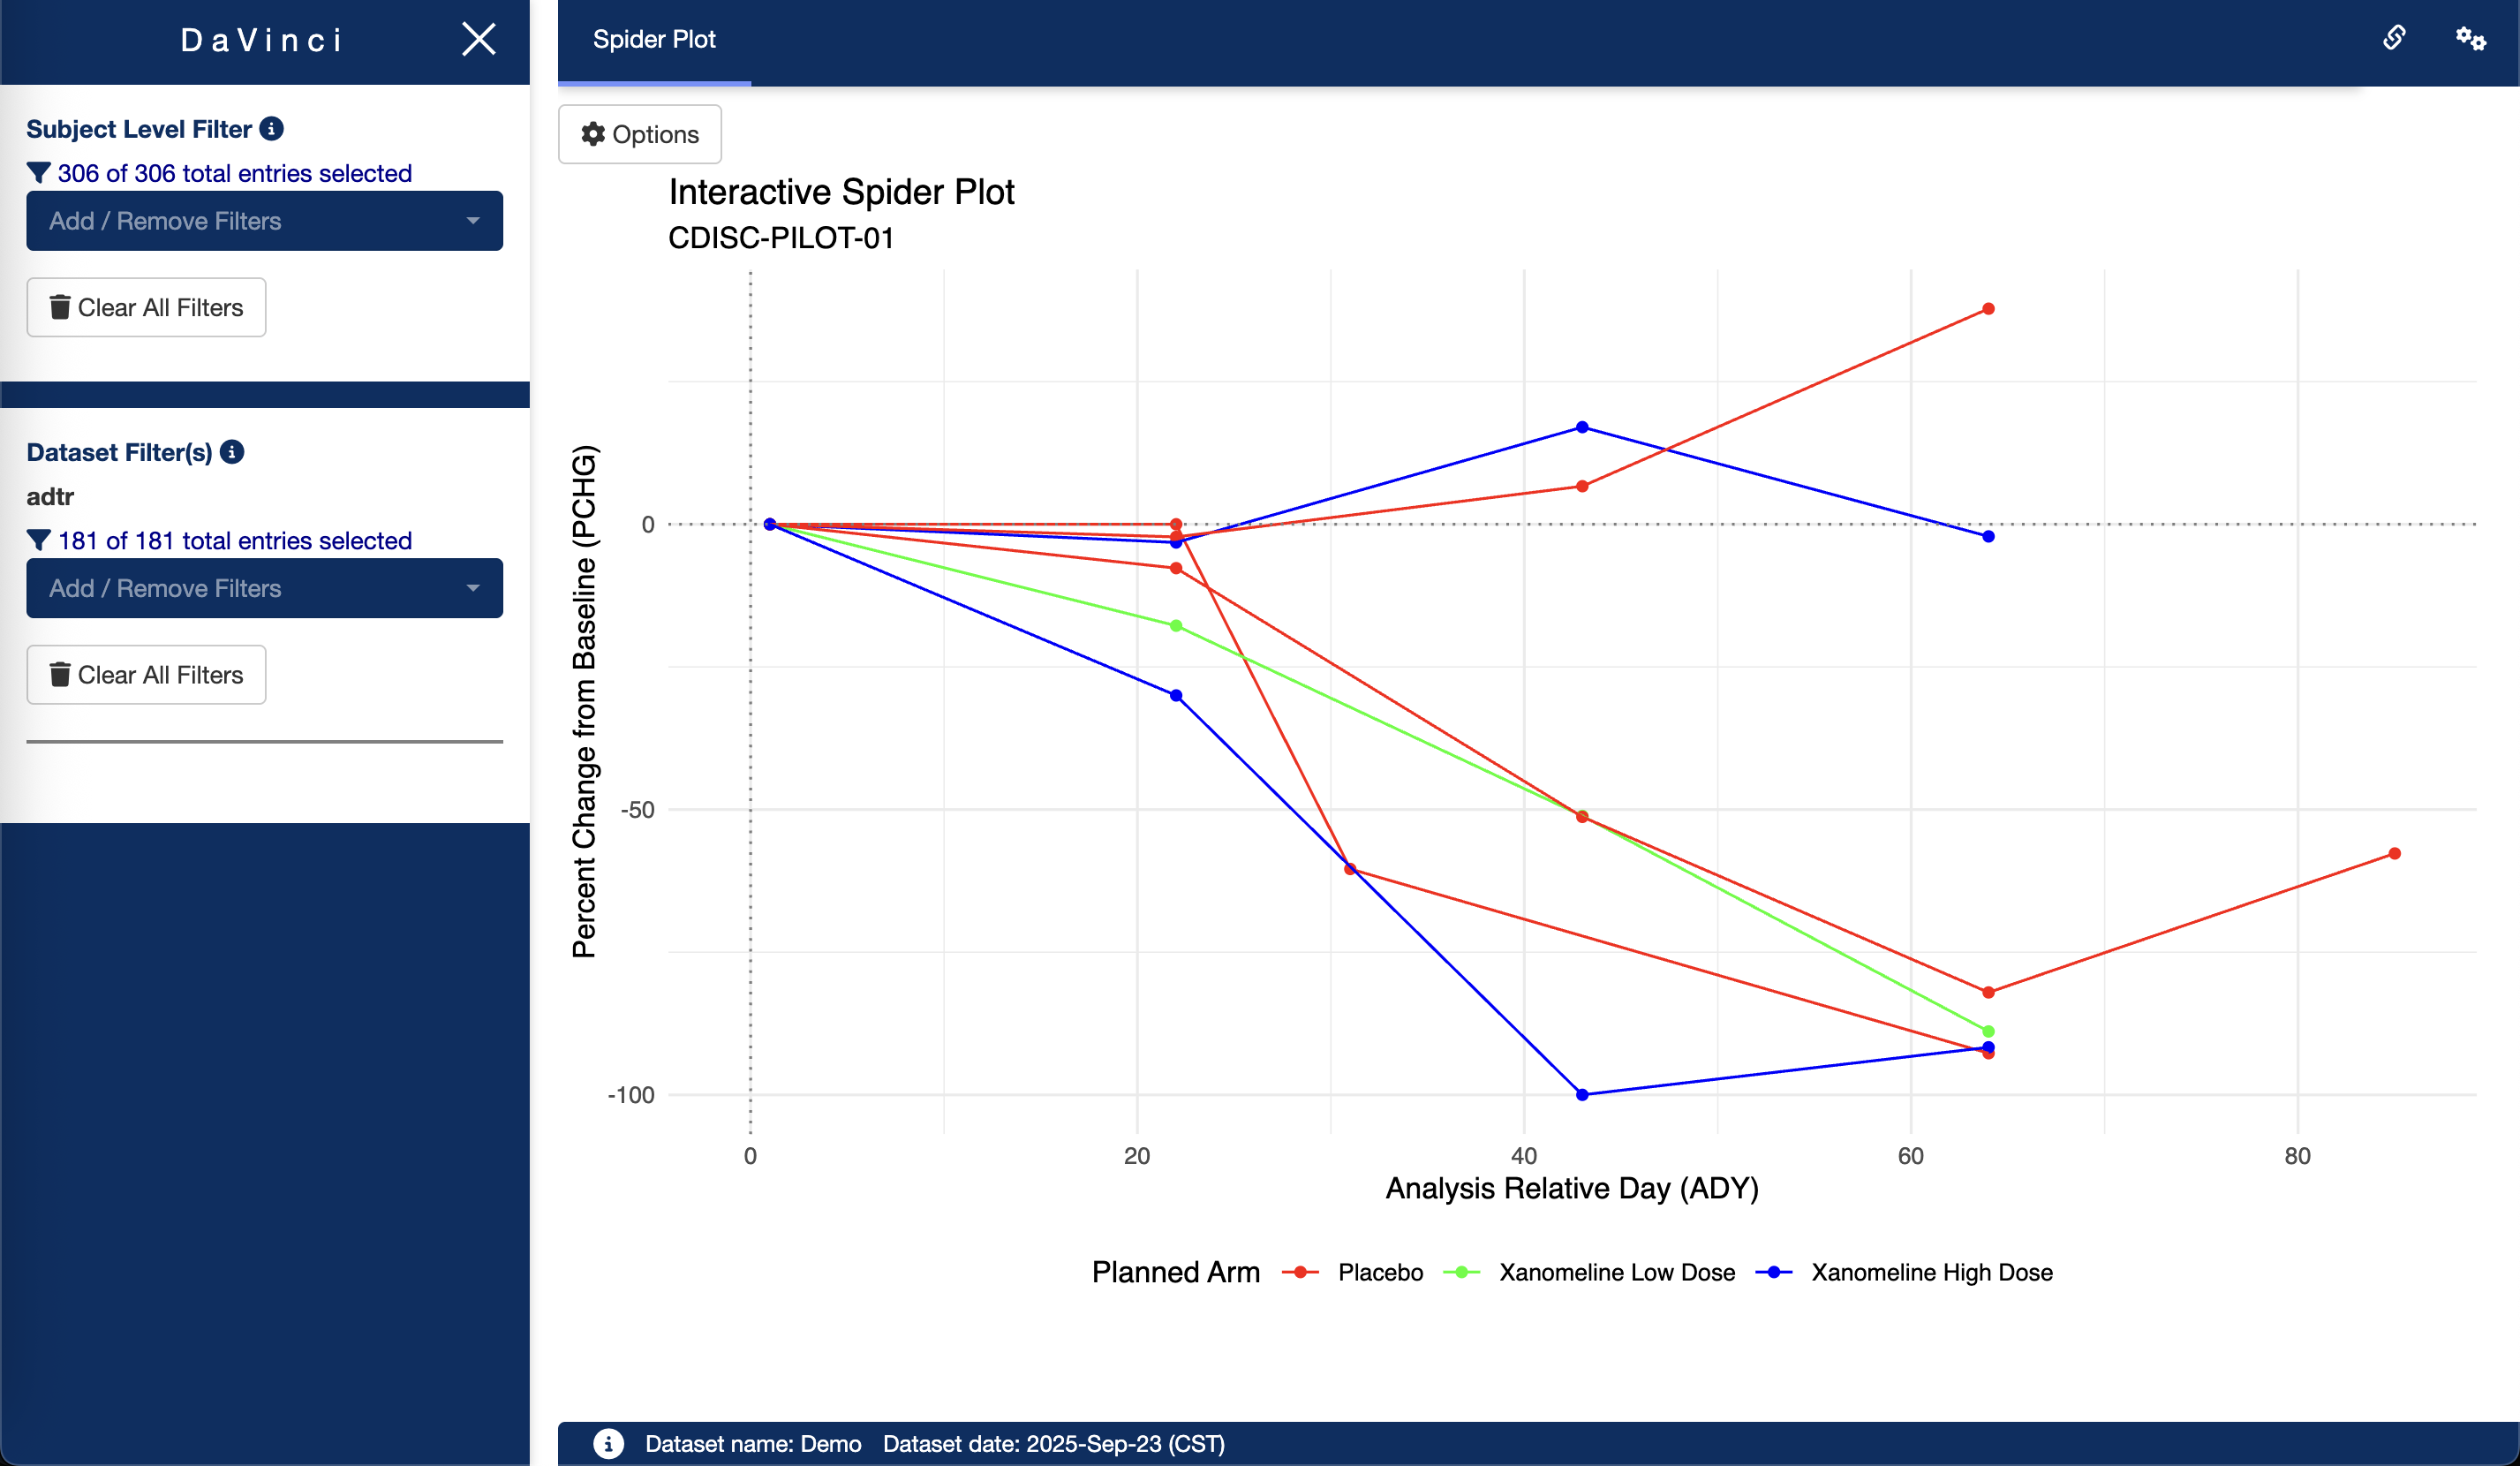
Spider Plot Example
Overview
The {dv.spiderplot} package provides a Shiny module for creating interactive spider plots that visualize patient-level response data over time. The module is designed to work with DaVinci’s {dv.manager} package and supports its filtering functionality. Spider plots are particularly valuable in oncology efficacy analysis, where they display individual patient trajectories showing changes in tumor size or other clinical measurements across multiple visits.
Installation
You can install the development version of {dv.spiderplot} from:
if (!require("remotes")) install.packages("remotes")
remotes::install_github("Boehringer-Ingelheim/dv.spiderplot")
See vignette("dv-spiderplot") for further information on how to use {dv.spiderplot} with {dv.manager} to create interactive spider plots with ADaM data from {pharmaverseadam}.