Pairwise visualization of simulated endpoints from a makeDataSim object
Source: R/utils.R
plot.makeDataSim.Rdplot.makeDataSim() produces a pairwise plot matrix for the simulated
endpoints stored in a "makeDataSim" object returned by
makeData.
Usage
# S3 method for class 'makeDataSim'
plot(x, arm = 0, names = NULL, ...)
Arguments
- x
An object of class
"makeDataSim", created bymakeData.- arm
Numeric scalar indicating which treatment arm to plot.
If the simulated dataset includes a
trtcolumn,armmust be one of0, 1, ..., K - 1, whereKis the number of arms.If the object was generated in control-only mode (i.e., no
trtcolumn is present), thearmargument is ignored and all simulated observations are plotted.- names
Optional character vector used to relabel the plotted endpoint columns.
If supplied,
namesmust have length equal to the number of simulated endpoints. This affects only the displayed labels in the plot and does not modify the underlying data.- ...
Additional arguments passed directly to
GGally::ggpairs(). This can be used to customize panels, labels, sizing, or other plot options.
Value
A GGally::ggpairs object, which is also a
ggplot-compatible object and can be printed or further modified using
standard ggplot2 syntax.
Details
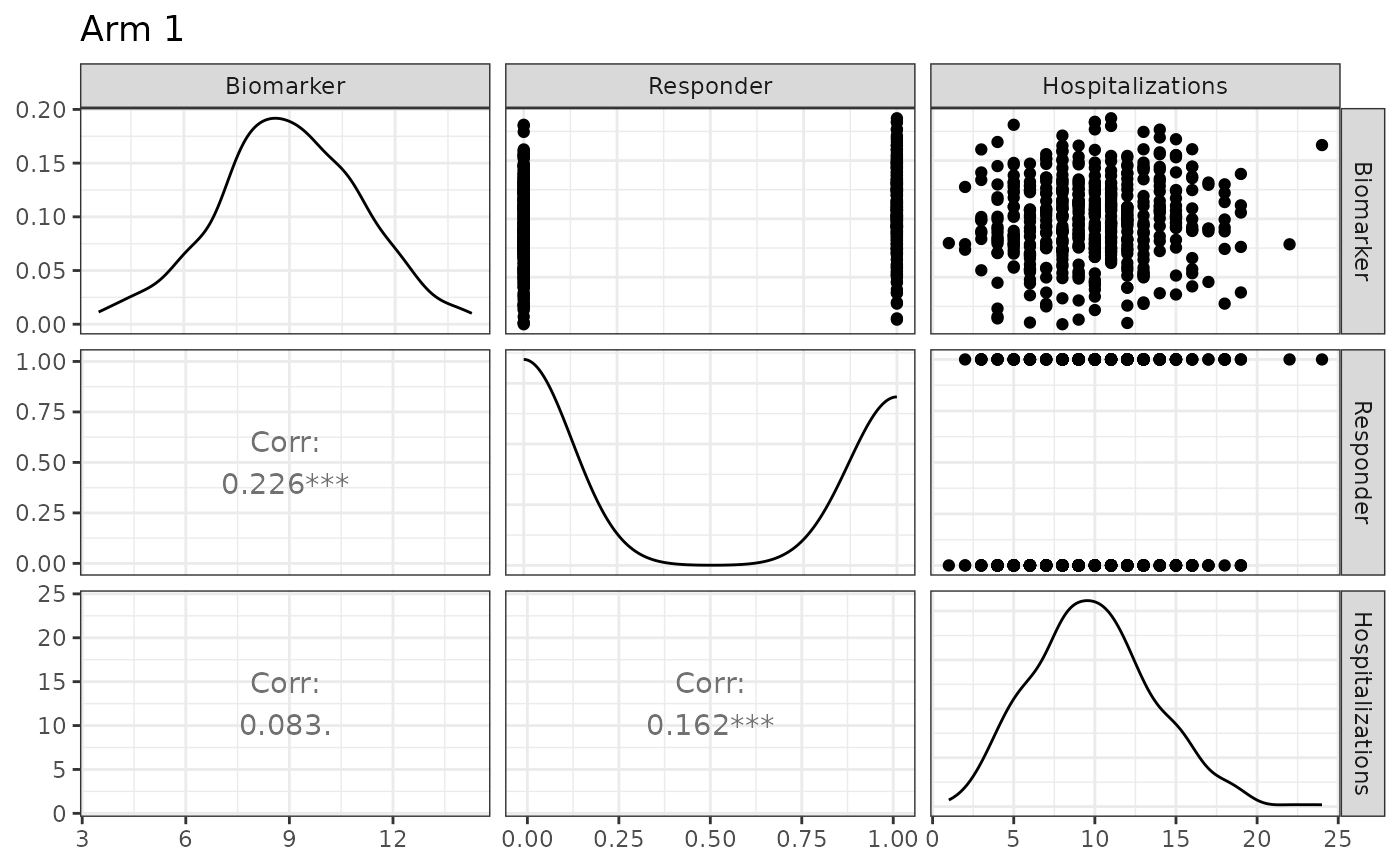
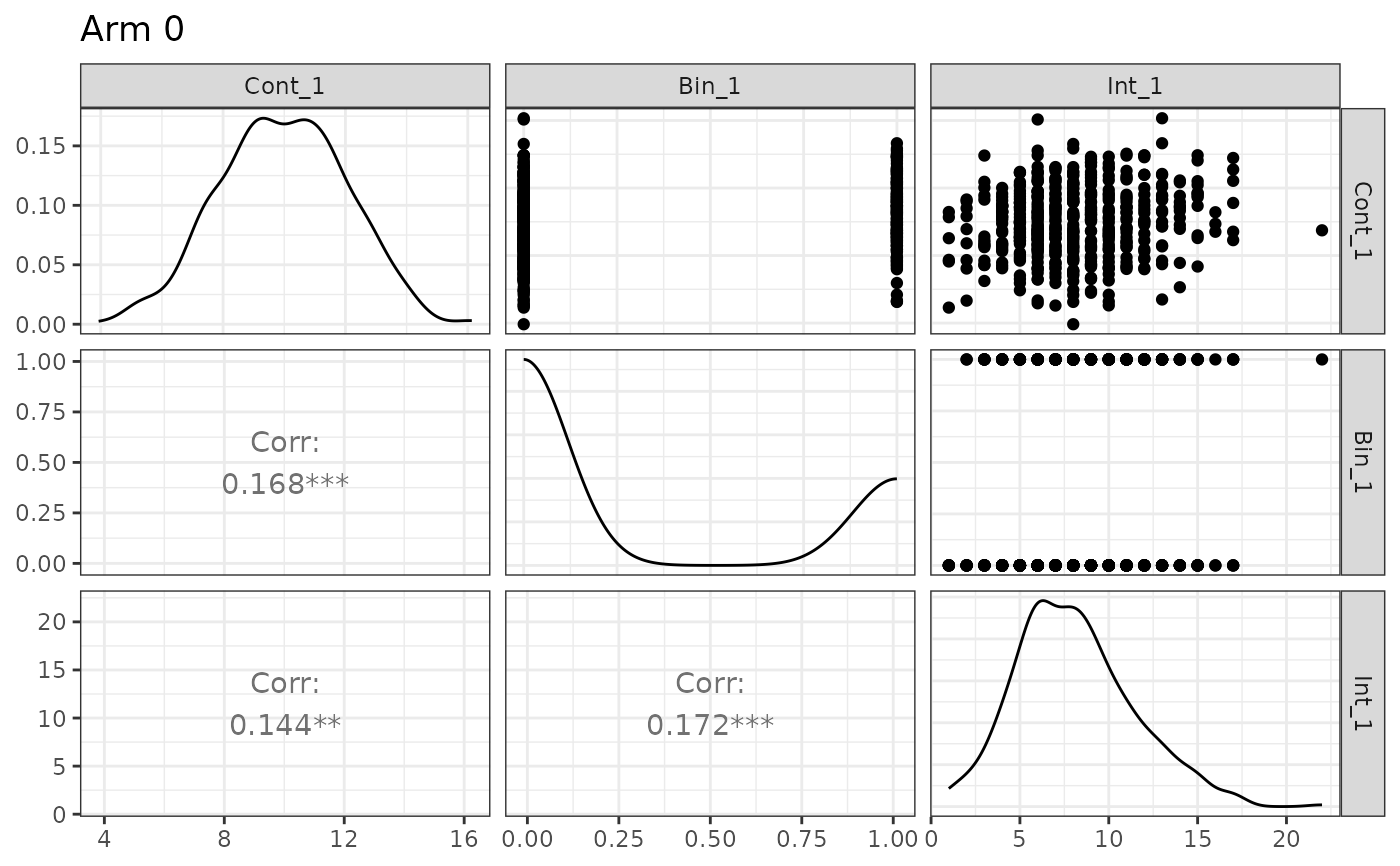
The method uses GGally::ggpairs() to display scatterplots in the
upper triangle and pairwise correlations in the lower triangle for the
selected study arm. This is intended as a quick diagnostic tool for
inspecting the joint structure of simulated endpoints.
Displayed data
The plotting method extracts the simulated endpoint columns recorded in
x$meta$endpoint_names. These are the automatically renamed endpoint
variables, such as:
- Continuous endpoints
Cont_1,Cont_2, ...- Binary endpoints
Bin_1,Bin_2, ...- Count endpoints
Int_1,Int_2, ...- Time-to-event endpoints
TTE_1,TTE_2, ...
Columns
such as trt, Status_*, and enrollTime are not included
in the pair plot.
Panel layout
The returned ggpairs object is configured as
follows:
upper triangle: scatterplots for continuous-style panels,
lower triangle: pairwise correlations,
title:
"Arm
<k>"
for the selected arm.
A ggplot2::theme_bw() theme is applied
by default.
Dependencies
This method requires both GGally and ggplot2. If either package is not installed, the method throws an error with an installation message.
See also
summary.makeDataSim for
numerical summaries of the simulated data.
Examples
ep1 <- list(
  endpoint_type = "continuous",
  baseline_mean = 10,
  sd            = 2,
  trt_effect    = -1
)

ep2 <- list(
  endpoint_type = "binary",
  baseline_prob = 0.30,
  trt_prob      = 0.45
)

ep3 <- list(
  endpoint_type = "count",
  baseline_mean = 8,
  trt_count     = 10,
  size          = 20
)

R3 <- corr_make(
  num_endpoints = 3,
  values = rbind(
    c(1, 2, 0.20),
    c(1, 3, 0.10),
    c(2, 3, 0.15)
  )
)

sim_obj <- makeData(
  correlation_matrix    = R3,
  sample_size_per_group = 500,
  SEED                  = 1,
  endpoint_details      = list(ep1, ep2, ep3)
)

## Plot control arm
plot(sim_obj)


## Plot treatment arm with custom labels
plot(sim_obj, arm = 1, names = c("Biomarker", "Responder", "Hospitalizations"))
## Plot treatment arm with custom labels
plot(sim_obj, arm = 1, names = c("Biomarker", "Responder", "Hospitalizations"))